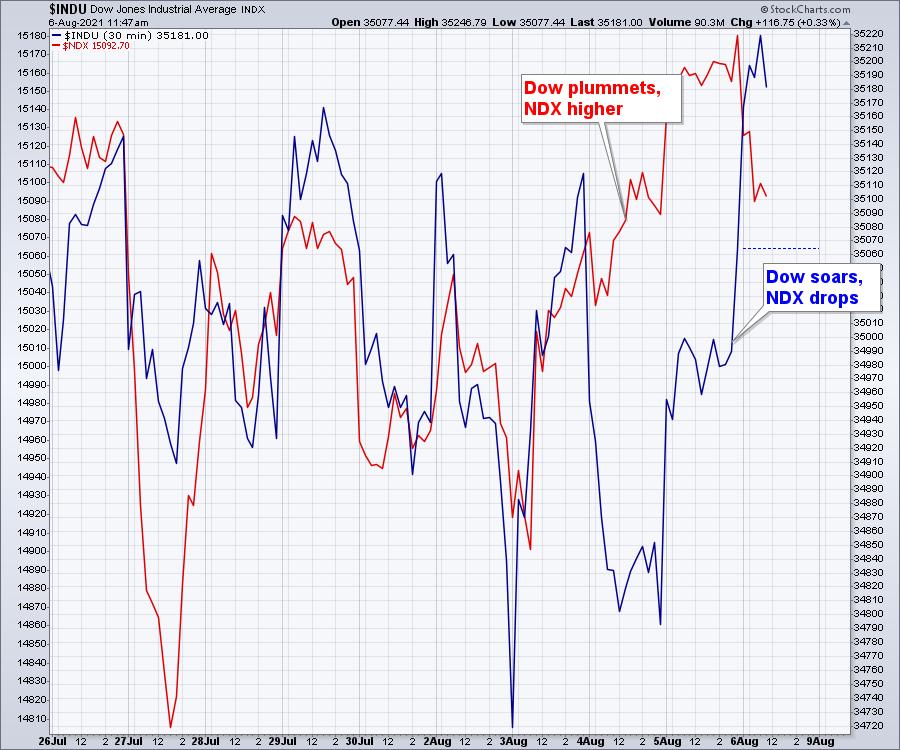
The market has really been a tale of two tapes this week.
On Wednesday, the Dow Jones Industrial Average dropped 290 points while the Nasdaq continued higher. By late Thursday, the Nasdaq was pausing and the Dow was climbing. After the jobs report Friday morning, the Dow soared and the Nasdaq was down just under 1%.
What makes this more than a casual observation is that the yield chart is also changing behavior throughout the week.
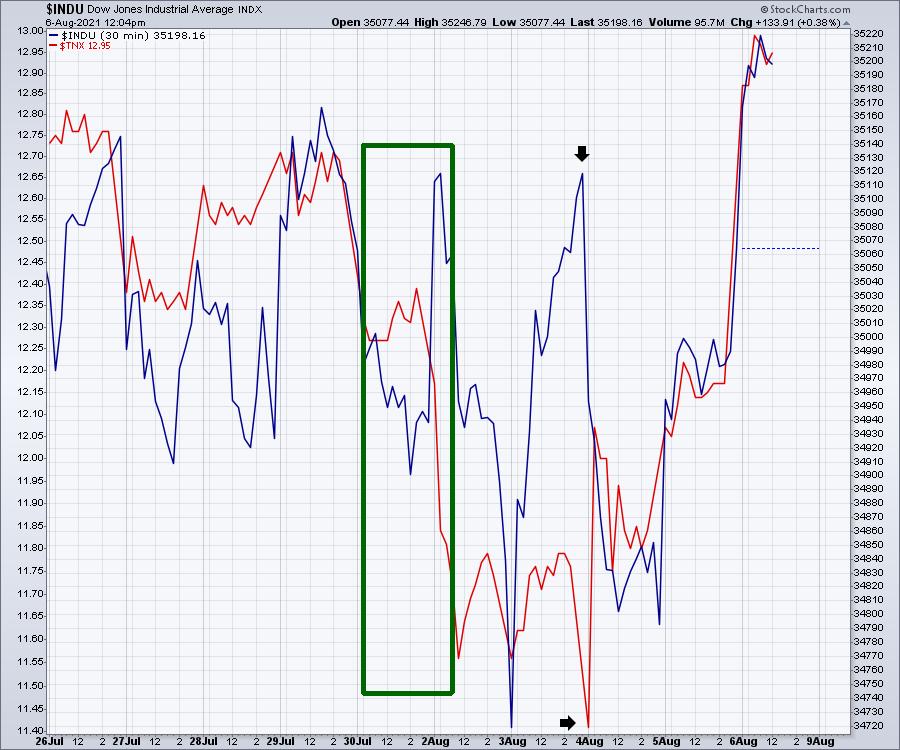
In the green box (Friday/Monday), yields rose as the Dow dropped. Then yields dropped within the box as the Dow started to rise,which was a bit of a change. They tried to get back in sync, but, at the black arrows, the two diverged quickly again. As we close out the week, it would appear they are getting back in sync.
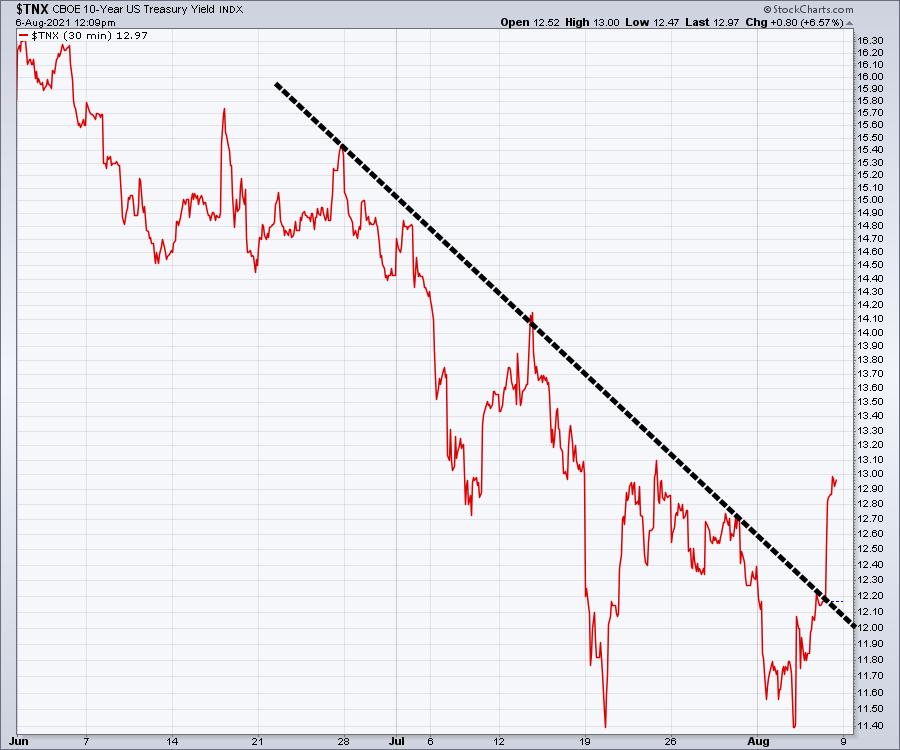
However, something else changed this week, that being that the big trend in Yields appears to be changing.
As we widen out the picture, we'll add the Industrials line back in.
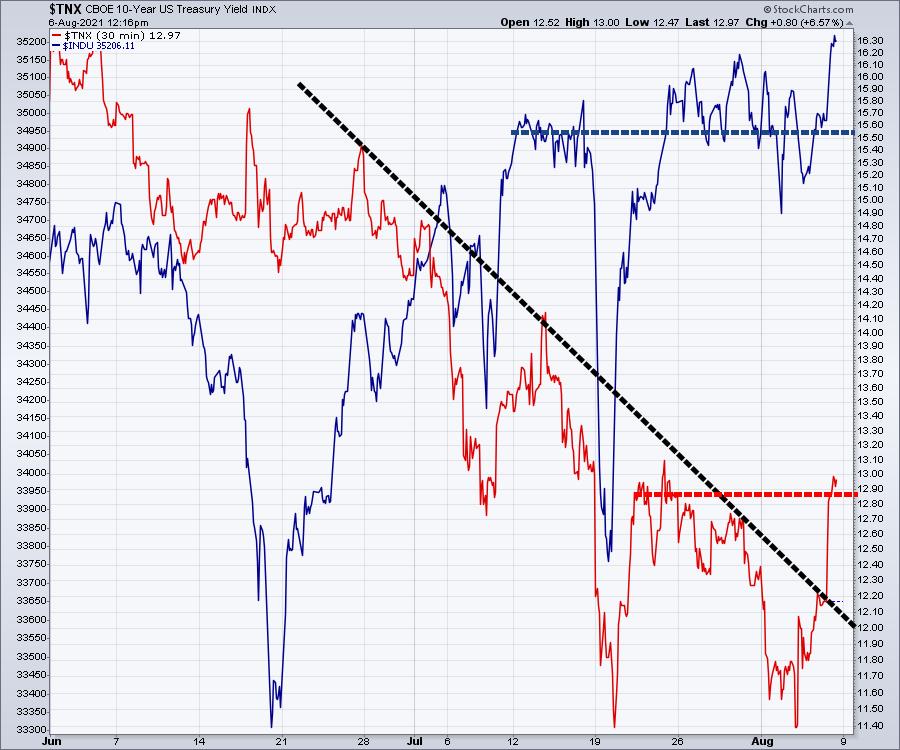
The Dow has been whipping around in June, whereas the yield in red stayed relatively stable. As the month of July progressed, they have been getting more in sync with each other, especially in the last few weeks. The Dow in blue was stabilizing sideways for the last three weeks, while the yield was building a base.
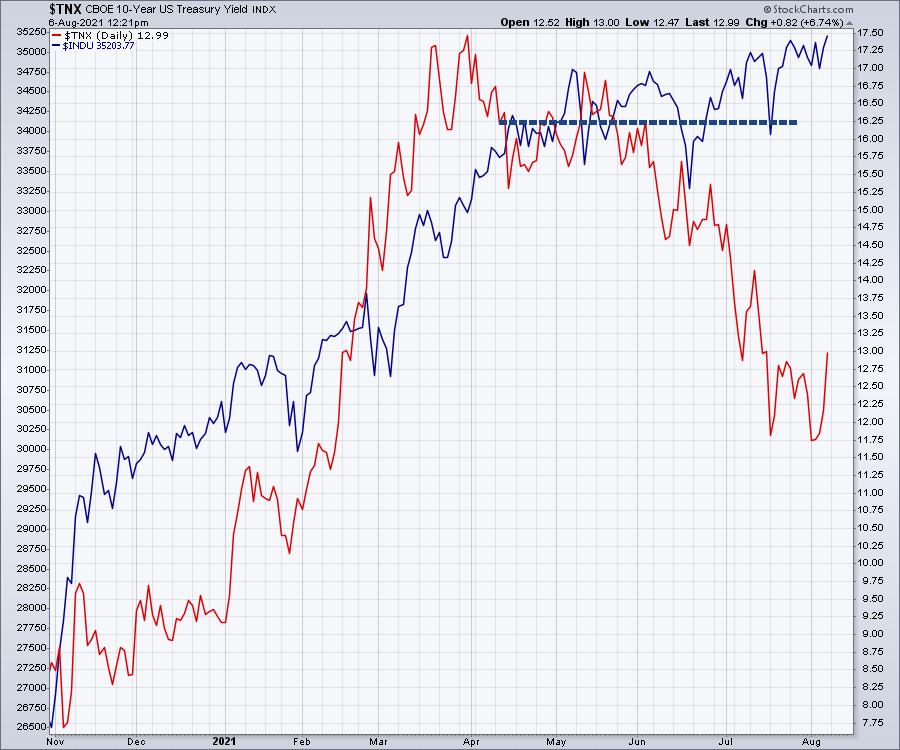
While the yields were correcting, the Dow line consolidated sideways. On this final chart, which widens out to a daily chart, we can see they are both breaking to higher closing (end of day) highs to close out the week. If yields are going to start rising, is it time to move back to the value trade? Tech stocks have been particularly strong since May, when the Dow and the yields started to diverge. That would include banks, energy and industrials. I'll be monitoring the performance of these groups to see if this is the start of the next rotation.
It's never easy to spot a rotation as it is occurring, but, if yields mark a bottom here, I want to be rotating with the trade. Hindsight is 20/20, as they say. Profits are made moving to where the market is going, not where it has been.
Good trading,
Greg Schnell, CMT, MFTA
Senior Technical Analyst, StockCharts.com
Author, Stock Charts For Dummies
Want to stay on top of the market's latest intermarket signals?
– Follow @SchnellInvestor on Twitter
– Connect with Greg on LinkedIn
– Subscribe to The Canadian Technician
– Email at info@gregschnell.com


