After a choppy period between the June Fed low and the recent Fed meeting, we finally got a market resolving to the upside. While everyone has flipped to bullish, with Apple, Amazon and Microsoft pushing the indexes up, let's check our work.
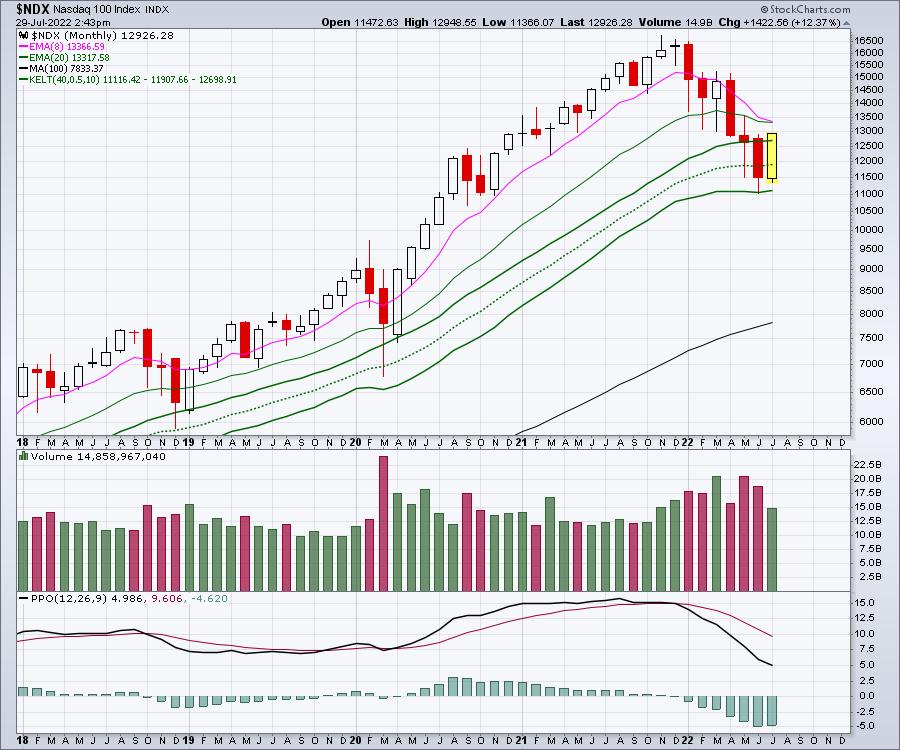
We need to look at a couple of bullish data points. First of all, the Nasdaq 100 took out the previous month's high. That's pretty bullish.
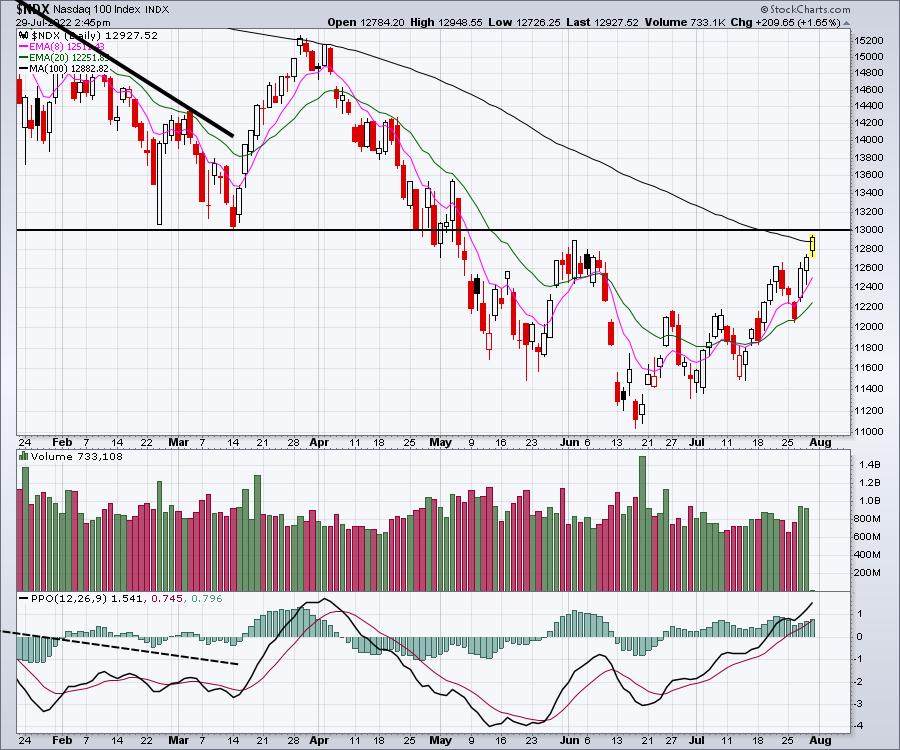
On the daily chart, we have some important levels showing up, with a series of higher highs and higher lows. Some important levels sit below us and above us. We took out the 4-week ceiling around 12200 in July after the Options expiration on Friday July 15th was behind us. Also notice the July 1 low.
We have rallied significantly for the month up 12.73%, which is a massive month. Nice turning point. On the upper side (resistance), we are testing the high of June. We are also testing the 100-period moving average.
When we widen this chart out, we have retraced to the neckline of the Head/Shoulders top. This is a very important technical level to respect. I will also point out that the PPO has rolled over around the 2% level for the last two years, which suggests we might be near the maximum momentum higher. Do we roll over suddenly now that earnings are behind us, or does market momentum stay elevated and keep running??
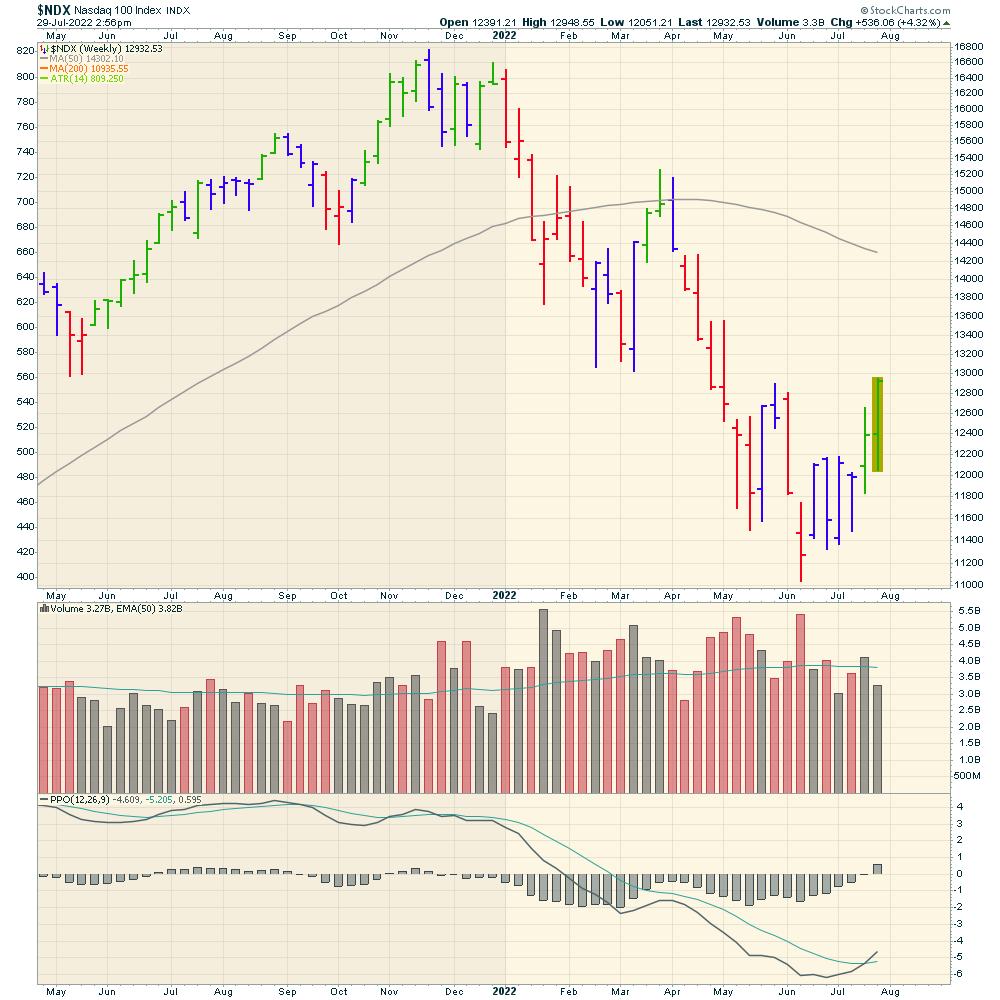
This is the second week of higher highs for the stock market, and that says the momentum trend is up. That is very bullish. However, we did see the same thing at the end of March.
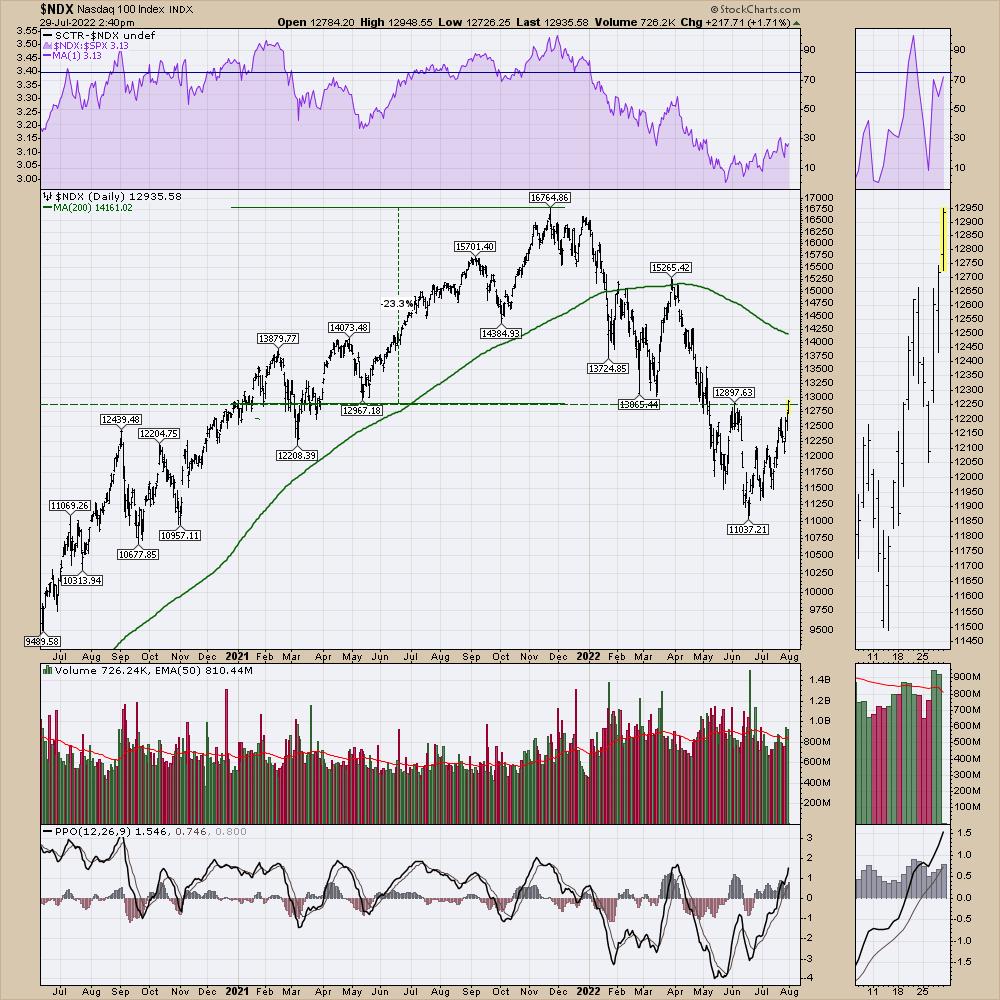
I do want to point out one thing that suggests watching the price action very closely. The red arrows show the market reversing near the first of the month, sending markets lower. The two black arrows show the markets reversing higher near the beginning of the month.
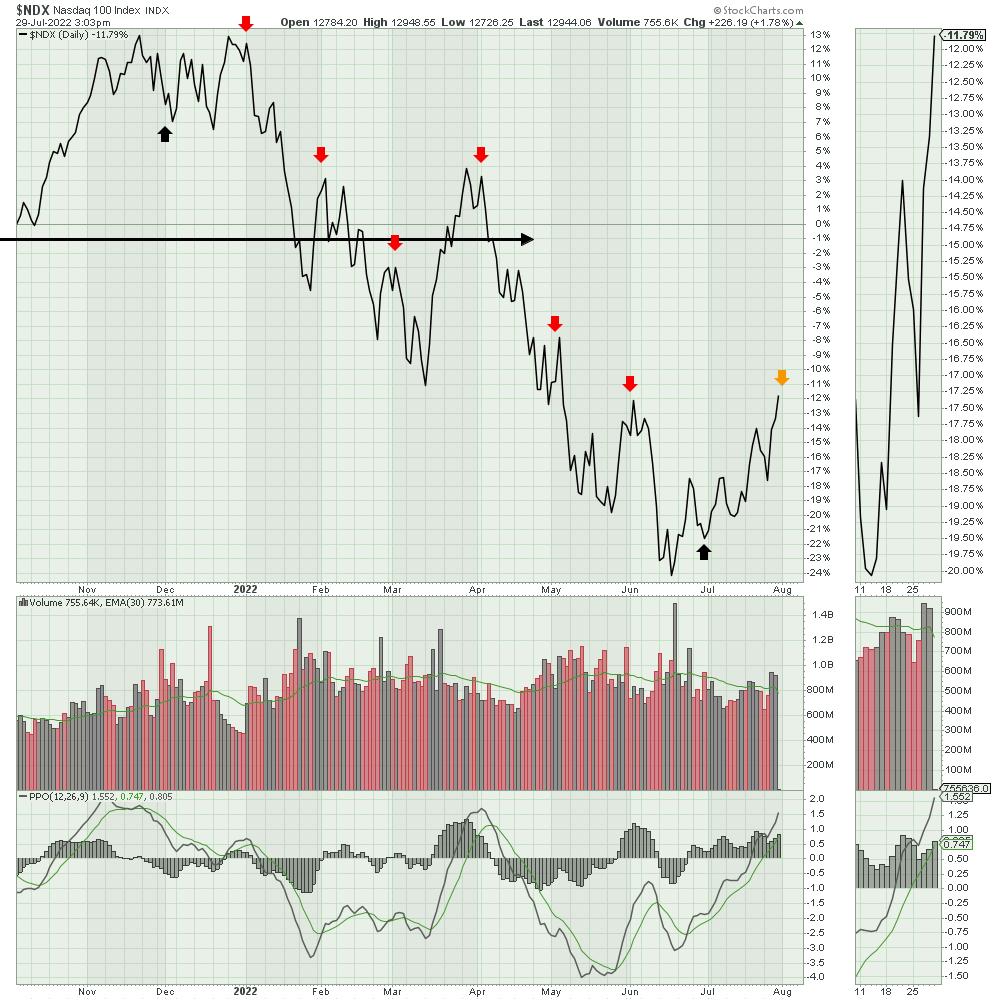
All that is to say the market is working its way higher. However, don't be complacent with a downtrending 200-day moving average.
If you'd like help understanding market momentum, feel free to try a subscription to the macro market overview on OspreyStrategic.org. For only $17/week, you'll find some good clues there that you don't find elsewhere.
Good trading,
Greg Schnell, CMT, MFTA
Senior Technical Analyst, StockCharts.com
Author, Stock Charts For Dummies
Want to stay on top of the market's latest intermarket signals?
– Follow @SchnellInvestor on Twitter
– Connect with Greg on LinkedIn
– Subscribe to The Canadian Technician
– Email at info@gregschnell.com


