Many ETFs (Exchange Traded Funds) pay dividends, but only one is devoted to dividend-paying stocks -- the Dow Jones Select Dividend Index Fund (DVY). As the name implies, this ETF is derived from the Dow Jones Select Dividend Index ($DJDVY), an index constructed and maintained by Dow Jones.
The Index is composed of about 100 stocks and is capitalization-weighted, which means the top one-third of the stocks in the index represent 60% of the weighting. A complete list is available on ishares.com. It is subject to change on a daily basis.
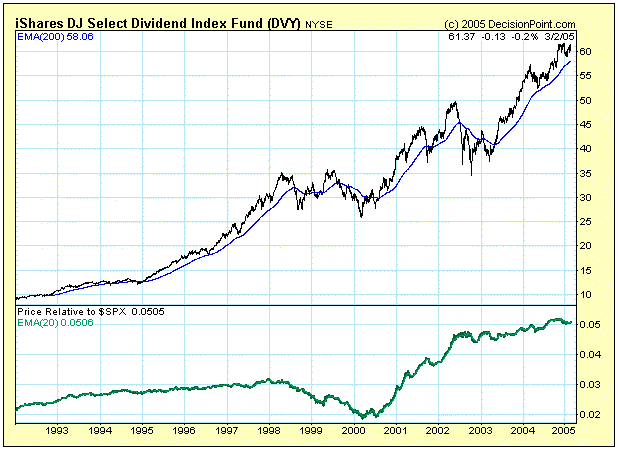
DVY has only been trading for about 14 months. Fortunately, Dow Jones has calculated historical data for the derivative index going back to 1992, so we have adjusted the index data so as to provide a theoretical price history for DVY. Now there is enough historical data to estimate how this fund will perform over the long-term.
The most impressive thing about the chart below is the relative strength line, which shows that DVY has out-performed the S&P 500 Index every year except 1998 and 1999. These were the years when investors abandoned dividends for the tech stock gold rush. At the 2000 top the S&P 500 was up nearly 300% versus only about 200% for DVY.
Since inception to the present DVY has advanced 500% versus 200% for the S&P 500, and the bear market didn't catch up to it until 2002 when DVY had a decline of 27% (versus a 50% bear market decline for the S&P 500). Since the 2002 low DVY has advanced about 75% versus 50% for the S&P 500.
When DVY first began trading, I thought it was just another ETF gimmick, but clearly this fund was a good idea. The chart demonstrates that value and growth can be synonymous. The current dividend is about 3%, which makes the stock overvalued if we compare it to the historical yield range of the Dow Industrials (3% to 6%). There is not enough dividend history to accurately estimate what undervalued is, but I'd guess it would be a yield of about 6%.

