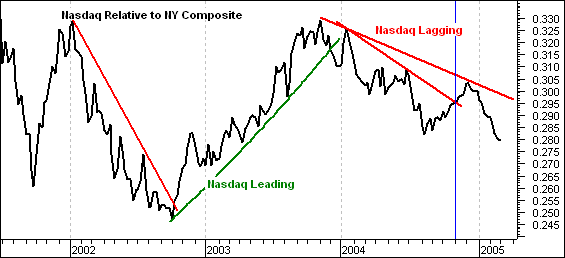
This chart shows the performance of the Nasdaq relative to the NYSE Composite. The market as a whole usually does better when the Nasdaq leads (green trendlines) and worse when the Nasdaq lags (red trendlines). Even though the NYSE Composite is performing well in the face of Nasdaq weakness, it would be doing a whole lot better with the Nasdaq leading – or at least participating.
Nasdaq outperformance peaked in Nov-03 and the price relative has declined steadily for over a year. There was a trendline breakout in November 2004 (blue line), but the price relative failed to move above the prior high and formed a lower high in December. The latest decline forged a new reaction low and it would take a move above .30 for the price relative to turn in favor of the Nasdaq again.
The recent problems within the Nasdaq are threefold. It is a one horse race and three of the top four industry groups remain under pressure. This has been the case since late January as the semiconductors took off, but Networking, Internet and Software continued lower or remained flat. Until one of these three joins the semiconductor group to make it at least a two horse race, the Nasdaq is doomed to underperformance.