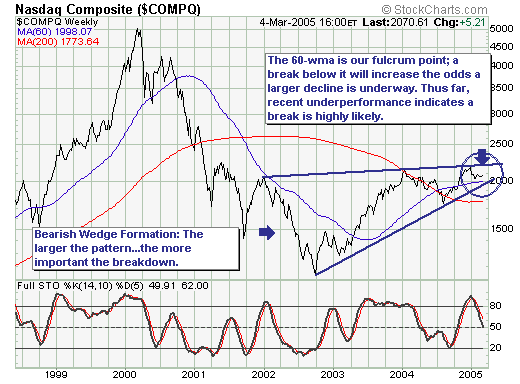
The recent rally to new yearly highs hasn't materialized in all the major indices. In fact, the Nasdaq Composite has lagged rather badly; thus it is either 'poised to catch up' or it will become the leaders once the cyclical bull market ends. We dont know when that will be; but our fulcrum point for adding to technology short positions will be upon the Composite breaking below its 60-week moving average at 1998...only 72 points below current levels.
That said, the larger bearish wedge pattern is also looming; a breakdown to 1900 would confirm this longer-term pattern. This isn't todays business as many of the traditional bearish signals seen at tops is only just beginning to materialize. However, it pays to have a game plan going forward...and technology short exposure is a good strategy as price declines materialize.