Things are jumping here at StockCharts. With the upcoming release of the next version of our main charting tool, I've been way too busy to watch the market closely. Fortunately, our crack team of market commentators has been on the case and you can find their bi-weekly dispatches below.
For those of you that have been sending us feedback on SharpCharts2, thanks! We've received over 400 messages from users about the most recent release - most of them very positive. People seem to love the ability to overlay anything on top of any other thing and the ability to have more than one stock on the same chart. If you haven't had a chance to check out SharpCharts2, what are you waiting for? Our current Beta version is open to everyone. Just be sure to read the Release Notes first!
Here's just a sample of the kind of charts that SharpCharts2 can create:
Chart 1
Chart 2
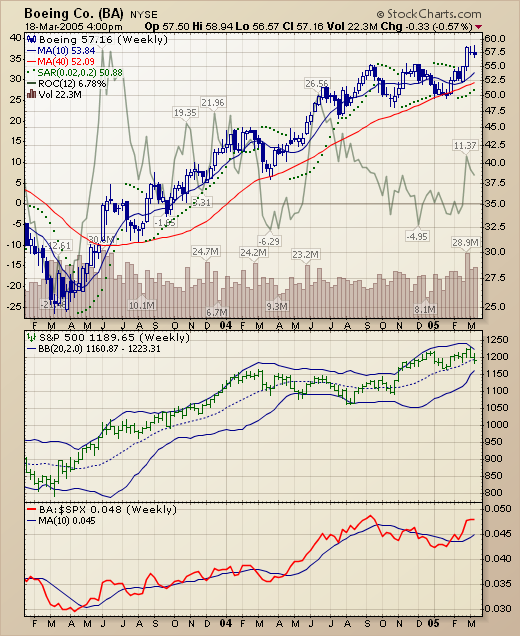
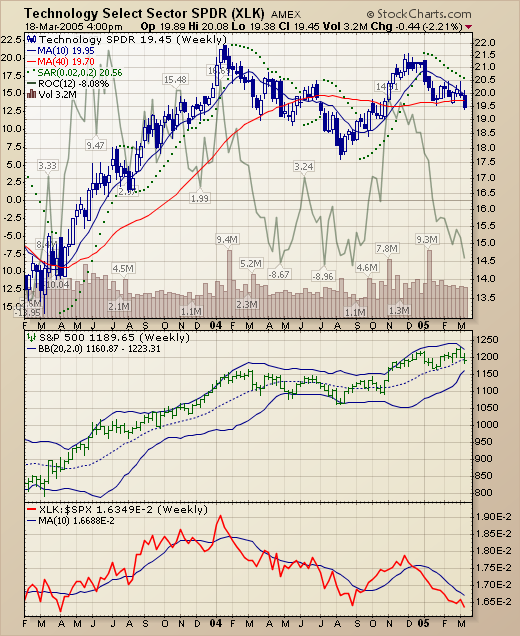
The first chart shows that Boeing (BA)has actually been outperforming the S&P 500 for some time now which the Technology sector (XLK in the second chart) hasn't been doing as well. (See the difference in the faded-green ROC lines and in the red ratio lines?)
The key thing these charts show are new features like:
- Value Labels on volume bars
- Control over the color of candles and bars
- Multiple datasets on one chart
- Custom overlays for indicators (the 40-week MA on the ratio chart)
- Custom indicator colors (the green ratio line)
- Multiple date/time axes
- Indicators placed behind the main chart (the ROC)
- Transparent indicators (the ROC)
- Candlesticks and OHLC bars on the same chart.
- and Value Labels on overlaid indicators (the ROC)
Whew! That's a lot of power in one charting tool! Can you handle it? Keep in mind that since this is still a Beta release, it still has bugs and that's what we are asking for help with. First, read the Release Notes, then, if you still have questions, you can use the "Report Problems" and "Discuss" links below any SC2 chart to tell us about any problems you encounter. Just click here to get started...
Now, on with the market commentary!
