ChartWatchers November 20, 2005 at 11:05 PM
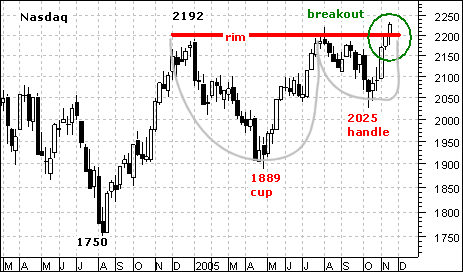
The Nasdaq's breakout at 2200 confirms a bullish cup-with-handle pattern and targets a move to around 2500. Until there is evidence to the contrary, this is the dominant chart pattern and further gains should be expected... Read More
ChartWatchers November 20, 2005 at 11:04 PM
When a stock is above a moving average it is considered bullish, and the stock can be considered to be in a rising trend for that time frame... Read More
ChartWatchers November 20, 2005 at 11:01 PM
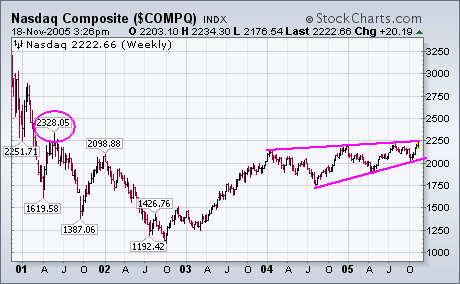
The chart below shows the Nasdaq Composite having hit a new four-year high this week. It's now trading at the highest level since the spring of 2001. There's another shelf of potential resistance to watch at 2328 (see circle), but the action has been impressive... Read More
ChartWatchers November 20, 2005 at 11:00 PM
This week the markets have started pushing into bullish territory... Read More
ChartWatchers November 06, 2005 at 11:05 PM
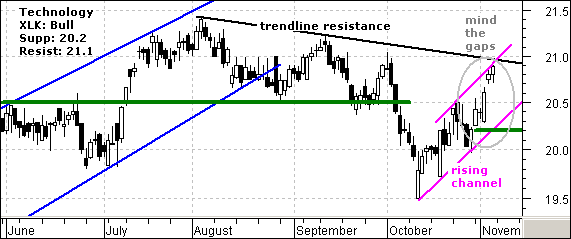
The Information Technology SPDR (XLK) broke support in early October, bottomed in mid October and surged over the last few weeks. This surge featured two gaps last week and these hold the key to recent strength. The stock gapped up on Monday and again on Thursday (gray oval)... Read More
ChartWatchers November 06, 2005 at 11:03 PM
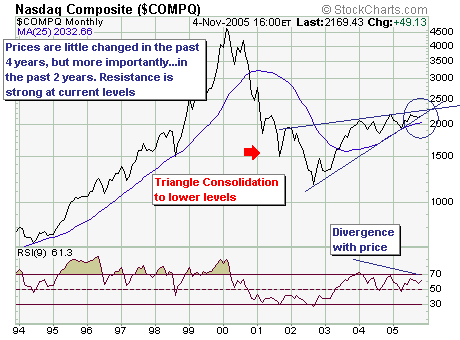
On a longer-term monthly basis, the Nasdaq Composite is very clearly forming a rather bearish "wedge" pattern. Resistance between 2080 and 2220 is quite strong, and rallies back into this zone are becoming weaker and weaker... Read More
ChartWatchers November 06, 2005 at 11:02 PM
OUR PROBLEMS ARE PUNY IN COMPARISON - While our weekend power problems were unusual, we realize that they were nothing compared to the problems faced by residents of the gulf coast in the aftermath of Hurricanes Katrina and Rita. For the past two months, StockCharts... Read More
ChartWatchers November 06, 2005 at 11:01 PM
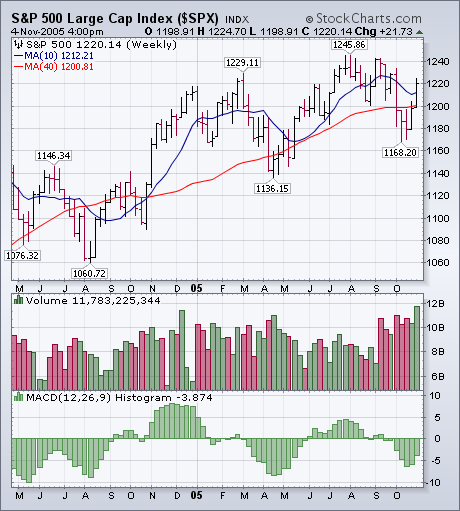
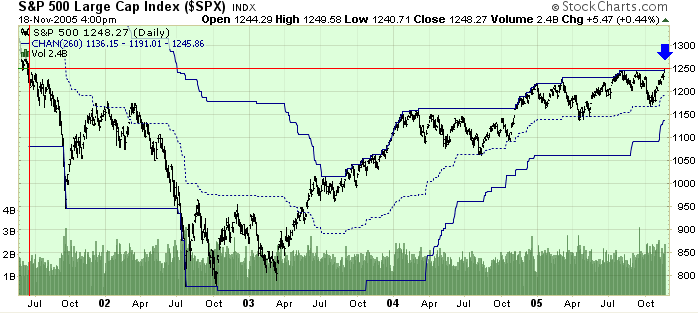
The weekly bars in Chart 1 show the improvement in the S&P 500 this past week. Not only did it close back over its (red) 40-week average, but it closed above its (blue) 10-week average as well. Even more impressive was the heavy upside volume... Read More
ChartWatchers November 06, 2005 at 11:00 PM
While last week was a really good week for the markets - Dow up 3%, Nasdaq up over 5% - it was a really lousy week for StockCharts.com. As most of you know, the site had problems creating charts on Thursday and again on Friday and then we were also down much of the day on Sunday... Read More