Back in November 2006 I speculated that the 4-Year Cycle trough had arrived in June/July 2006, and that the implication was bullish for stocks – bullish because we normally expect an extended rally out of those cycle lows. At this point, I think that assessment is proving to be correct because there has been a substantial rally, and the recent correction low has failed to challenge the 2006 lows. In other words, the first leg of the current 4-Year Cycle has shown unusual strength, and it is reasonable to assume that there could be a few more good up legs before the bull market finally tops out.
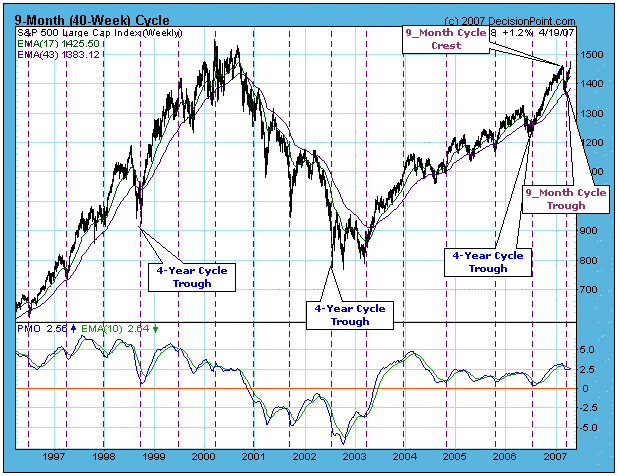
In a shorter-term context, we can also note that the March low also marks the cycle trough for the 9-Month Cycle that began last summer in conjunction with the 4-Year Cycle. I had expected the 9-Month Cycle trough to arrive this month (around April 16), but, since the S&P 500 has already exceeded its February high, I have to accept the March 14 low as being the cycle trough – having arrived one month early. Another feature of that cycle is that the high price point in the cycle (the crest) is located on the extreme right side of the cycle arc. This is a bullish configuration.
Assuming that we are beginning a new 9-Month Cycle, and assuming that the bullish configuration (right-hand cresting) persists, it will be about six months or more before the next important price top arrives. Regarding this estimate, I would pencil it in, rather than using chisel in stone.
A casual examination of the cycle chart will reveal that there really is no typical cycle configuration, and the spacing between troughs can be terribly inconsistent for the 9-Month Cycle and subordinate (shorter) cycles; however, cycle analysis does provide a certain context that can be applied to price movement, which can be useful to the intuitive side of the brain.
Bottom Line: Cycle analysis is an imperfect tool, but current cycle orientation is more clear than usual, and it is bullish for stocks, probably for several months.
