want to recap what was discussed in the last ChartWatchers newsletter. We were approaching significant long-term price support on the Dow and the lower trendline on the NASDAQ while pessimism was starting to ramp up. I discussed the possibility of a significant bottom approaching and to watch for the put call ratio to spike near the levels we saw in March and August of 2007.
First, let's take a look at the Dow chart.
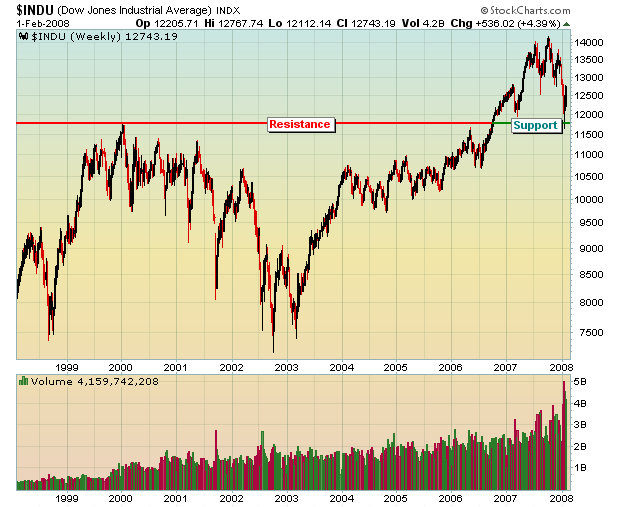
The Dow touched critical support and bounced 1000 points. The 13,000 area is a bit congested and will provide the bears some ammo as they attempt to fight back the bulls. If the market weakens, the recent lows and that long-term support area near 11,700 become HUGE. So for now, I'm looking for the Dow to be range-bound though I do maintain a slightly bullish bias with respect to the market overall. Economic supply and demand favors the bulls - just ask the shorts in the financial, homebuilding and retailing sectors.
Next, let's look at the NASDAQ uptrend channel that I discussed two weeks ago.
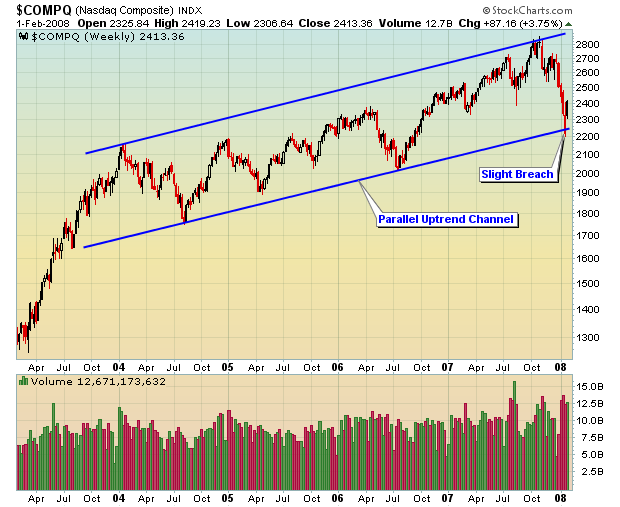
The NASDAQ moved down and briefly broke the trendline support level near 2240. Trendlines are not an exact science, however, so we must give a little room. In this case, the NASDAQ dropped down near 2200, but quickly recovered back into the channel. If you're in the bullish camp, you do not want the NASDAQ to lose 2200 as we move forward. That would result in a long-term trendline break AND violation of price support. We would likely see another 200 point decline to 2000 if that were to happen. I don't believe we'll see it.
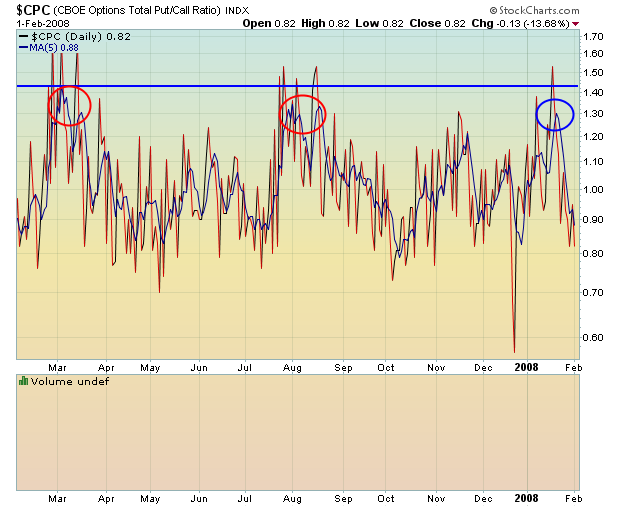
Finally, did the pessimism ramp up as measured by the 5 day put call ratio? We've used this tool with tremendous success in helping to spot long-term bottoms. It's one of our key long-term sentiment indicators. Look at the chart below to see how the 5 day moving average of the put call ratio spiked as the market found a bottom. The red circles below indicate the 5 day moving average of the put call ratio in March and August of 2007. The blue circle shows us that the fear did in fact jump at the recent market bottom to suggest the last few sellers made it to the party just as it ended.
Happy Trading!


