Hello Fellow ChartWatchers!
The Real Estate industry is undergoing lots of challenges right now. Let's see how those challenges are affecting the REIT charts. Check out the current chart for the Dow Jones REIT index:
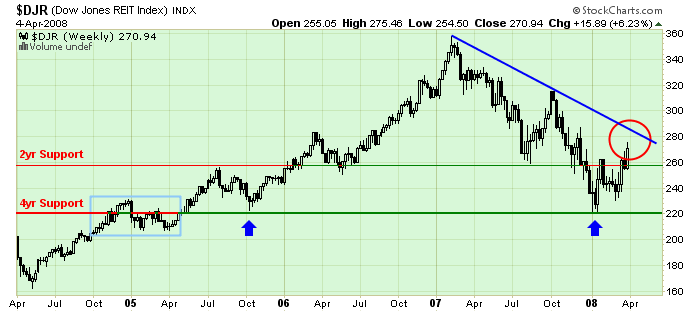
The problem with REITs is clear here - the blue downtrend line that started back in early 2007. It was created when the spike in October faltered around the 315 level.
The other problem is the break in the thin "2yr Support line" (just below 260) that happened back in December. That support level was created in mid 2005 and confirmed in June on 2006. It provided support in August of 2007 after the collapse began, but failed spectacularly last December. Since then, it's been a resistance level for the index - that is, until last week...
The longer term picture focuses on the 220 support level - the "4yr Support" line that I added. That level was created in late 2004 and confirmed in Oct. 2005. Recently, it halted the free fall at the start of 2008 and continues to look pretty strong.
The short-term question is "Will the index be able to break through that blue downtrend line? Or will it bounce lower and retest those two support levels again? ChartWatchers should be paying close attention to these key tests in the next couple of weeks.


