I'm the conservative type. I'm also nervous. I never like to see the market fall precipitously while market participants yawn. In a nutshell, that's what we've been seeing. Yes, the talking heads will say the sky is falling, but unfortunately for bulls, that's not the case amongst those actually trading the market. I've provided in previous articles how the put call ratio correlates to market tops and bottoms. I won't go into the details again. However, everyone needs to understand that market participants are not panicking yet. That is a very big clue to me that we've got more work to the downside before we can declare a bottom. It doesn't mean we can't bounce and I'll provide an argument below that suggests a near-term bounce is imminent. But it will likely be just that - a bounce.
First, let's talk sentiment. Thursday, the put call ratio printed a closing reading of 1.21. Finally! It was the 3rd highest end of day reading since the mid-March lows. That's the good news. The bad news is that one day of negative sentiment doesn't mark a bottom. Below is a favorite chart of mine, measuring the 5 day moving average of the put call ratio against the 60 day moving average. It simply plots the short-term pessimism against the longer-term pessimism, and provides us with a measure of relative pessimism. I like to see the short-term 20%-30% higher to begin to mark bottoms (and 20%-30% lower to mark tops). From Chart 1, you'll see we're simply not there yet so strap on your helmets and buckle your seatbelts.
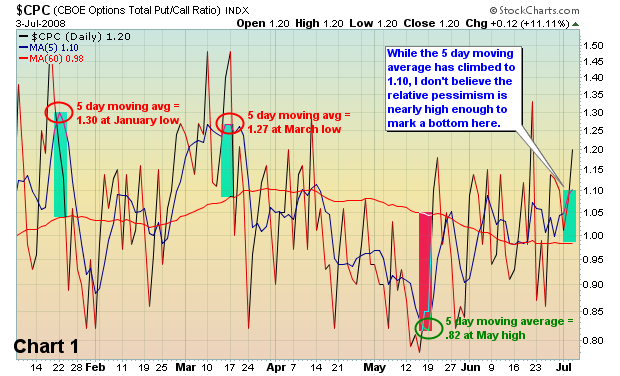
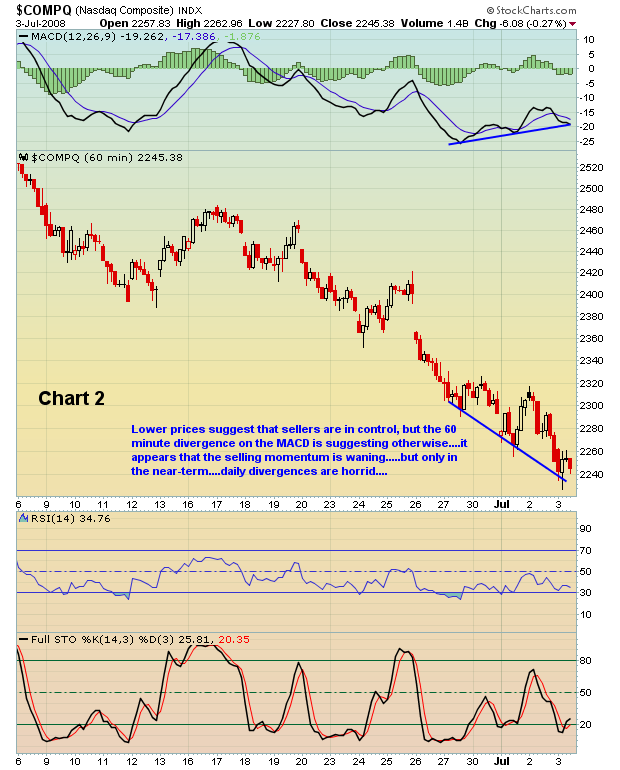
We could continue lower, the pessimism could build, and a significant bottom could form in the near-term. Given the severely oversold conditions though, I expect to see a bounce first and that will likely return the 5 day put call ratio down closer to the 60 day moving average, possibly even below the 60 day. Furthering my belief of a short-term bounce is the positive divergence that has printed on the 60 minute charts. The major indices have put in new lows the last 3 days, and with each new low has come a higher MACD reading on the 60 minute chart. Take a look at the NASDAQ below in Chart 2.
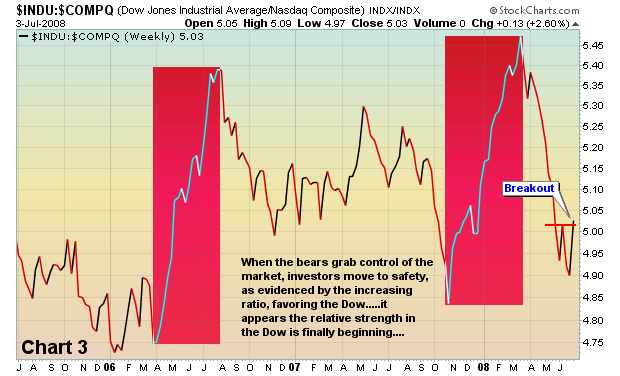
I'll leave you with one more chart to ponder. Normally when the market sells off, the Dow outperforms the NASDAQ. That makes perfect sense as investors flock to high quality, "safer" investments. From Chart 3 below, you can see that the ratio between the Dow and the NASDAQ moved much higher during the summer of 2006 and again in fall of 2007 into the first quarter of 2008 as the market sold off hard. Any time this ratio moves up, it indicates relative outperformance by the Dow. A declining ratio suggests relative outperformance by the NASDAQ. Here's the interesting part: Since the May 19th top, this ratio has actually declined. We just suffered through the worst June in several decades, yet the money did not gravitate towards the Dow - interesting indeed. Is this a short-term phenomenon that will rectify itself in due time? I say yes. I've highlighted the recent move up in the ratio and believe that the move above the recent high is technically significant.
We'll find out in time. In the meantime....
Happy trading!


