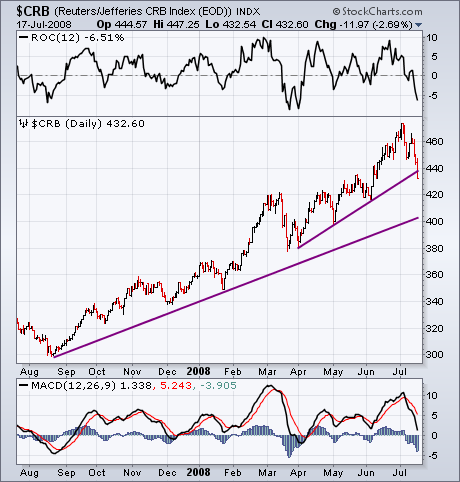
This week's downturn in crude oil prices has had a depressing effect on the entire commodity group. Chart 1 shows the CRB Index (plotted through Thursday) breaking a three-month up trendline (and its 50-day moving average). The 12-day Rate of Change (ROC) line (top of chart) has fallen to the lowest level in more than three months. And the daily MACD lines (bottom of chart) have turned negative after forming a "double top" between March and July. The minimum downside target is most likely a test of the 400 level which would test a yearlong support line and the early May low. I wouldn't, however, rule out a further drop to the March low at 380. The weekly CRB chart also suggests a very over-extended market in need of a correction.

About the author:
Chip Anderson is the founder and president of StockCharts.com.
He founded the company after working as a Windows developer and corporate consultant at Microsoft from 1987 to 1997.
Since 1999, Chip has guided the growth and development of StockCharts.com into a trusted financial enterprise and highly-valued resource in the industry.
In this blog, Chip shares his tips and tricks on how to maximize the tools and resources available at StockCharts.com, and provides updates about new features or additions to the site.
Learn More


