ChartWatchers August 17, 2008 at 10:05 PM
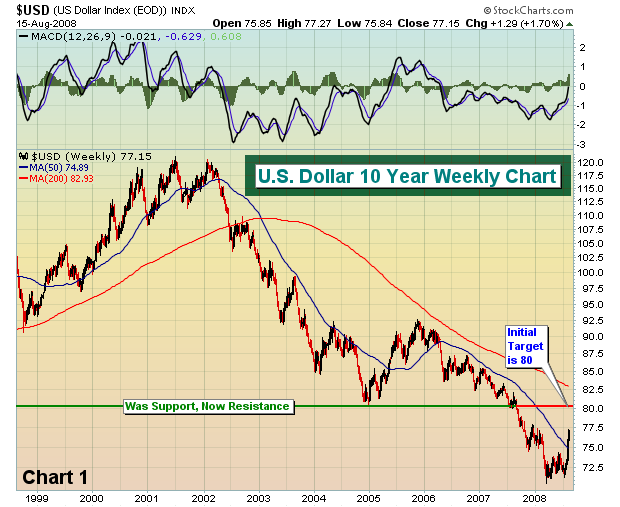
The dollar has bottomed and is beginning to trend higher for the first time in several years. Dropping crude oil prices are pushing gas prices lower at the pump and the dollar is strengthening. That's a combo that should make most consumers feel wealthier in time... Read More
ChartWatchers August 17, 2008 at 10:03 PM
The rally that began off the July lows has not demonstrated the kind of strength we normally expect from the deeply oversold conditions that were present at its beginning... Read More
ChartWatchers August 17, 2008 at 10:02 PM
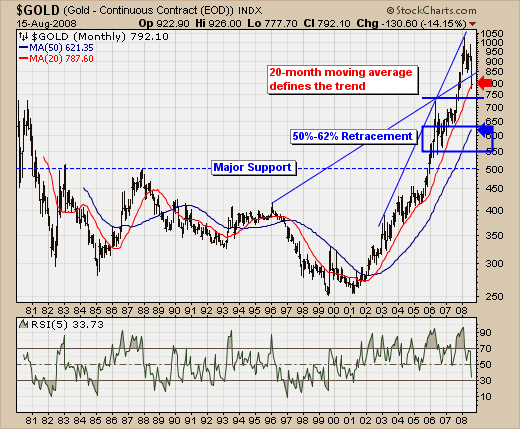
The past month in the commodity markets has been a treacherous as we have seen it in recent years; and not one commodity has been spared. That said, our focus is upon gold futures given they have dropped from a high of $1,033.90 to their current level of $792... Read More
ChartWatchers August 17, 2008 at 10:01 PM
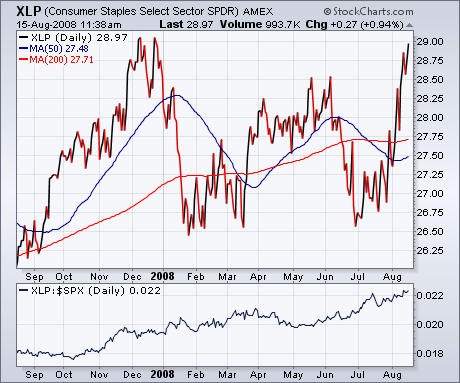
Until proven otherwise, the two strongest market sectors are still consumer staples and healthcare. And both are defensive categories. Chart 1 shows the Consumer Staples Select (SPDR) trading at a new eight month high after breaking through its spring high... Read More
ChartWatchers August 17, 2008 at 10:00 PM
When was the last time you saw a 100% accurate weather forecast for your area? Chances are that at least some of the weather predictions your local weather person tells you won't come to pass. In many cases, most of the predictions are wrong... Read More
ChartWatchers August 02, 2008 at 10:05 PM
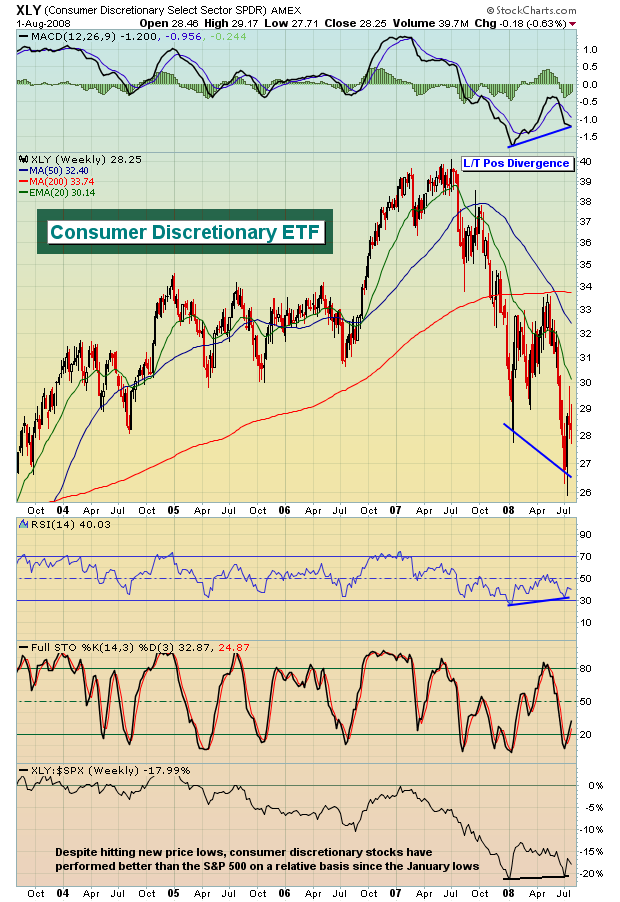
Spotting tops and bottoms is perhaps the best reason for utilizing technical and sentiment indicators in your investing and trading arsenal. The first signs of a bottom forming can be subtle and I'm beginning to see a few... Read More
ChartWatchers August 02, 2008 at 10:04 PM
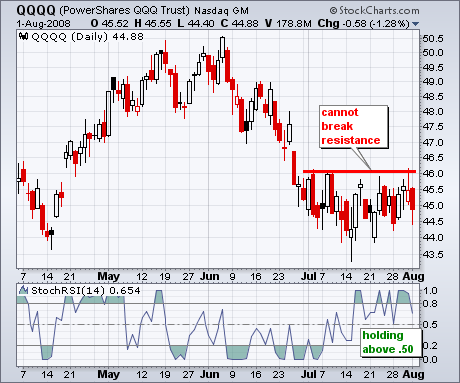
The Russell 2000 ETF (IWM) and Nasdaq 100 ETF (QQQQ) were stifled at resistance this week and the bulls are getting a test. After surging above 69, IWM met resistance at broken support and the 62% retracement mark... Read More
ChartWatchers August 02, 2008 at 10:03 PM
The rally that began nearly three weeks ago, out of the jaws of a potential crash, has become rather unimpressive in the last two weeks... Read More
ChartWatchers August 02, 2008 at 10:02 PM
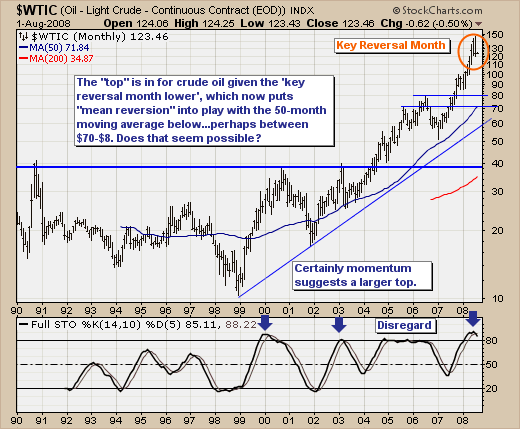
This past July-2008 was a very important month for the capital markets; crude oil peaked and traded lower by -11%... Read More
ChartWatchers August 02, 2008 at 10:01 PM
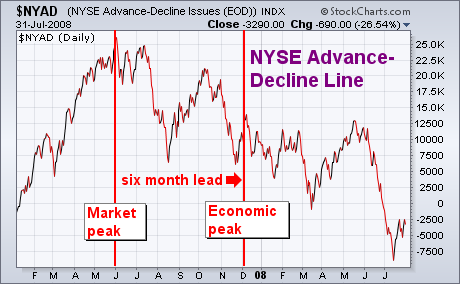
In a recent Market Message, I discussed how the stock market is a leading indicator of the economy and why it isn't a good idea to use economic forecasting to trade the stock market. Historically, the market turns down at least six months before the economy... Read More
ChartWatchers August 02, 2008 at 10:00 PM

Hello Fellow ChartWatchers! Let's start the month of August off right with a good, old-fashioned education article about the modern version of a good, old-fashioned chart overlay, Keltner Channels! Here we go..... Read More