ChartWatchers September 21, 2008 at 10:05 PM
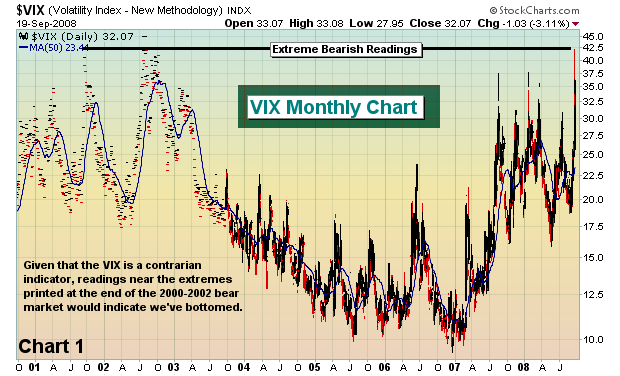
Market bottoms come in all shapes and sizes, but most have a few key ingredients. Without exception, critical market bottoms are borne out of excessive fear and panic. On Thursday, the VIX shot past 42... Read More
ChartWatchers September 21, 2008 at 10:04 PM
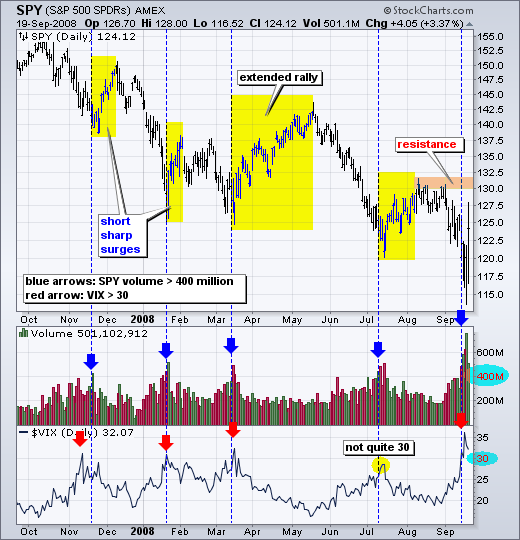
Volume and volatility surges foreshadowed bear market rallies in November, January and March. Both surged again this week and the market took notice with a huge bounce over the last two days... Read More
ChartWatchers September 21, 2008 at 10:03 PM
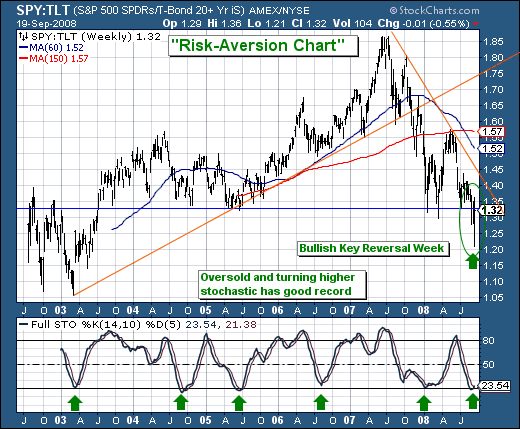
In my September 5 article I said that I thought is more likely that we would see a continued decline, rather than a retest of the July lows. This week the market blew out the July lows and was very near to crashing on Thursday... Read More
ChartWatchers September 21, 2008 at 10:02 PM
We'll admit last week was one of the more "interesting" trading weeks we have seen in a number of years, and if we must liken it to anything we've seen in our 25-years of trading - it would be the week before and of the 1987 Crash... Read More
ChartWatchers September 21, 2008 at 10:01 PM
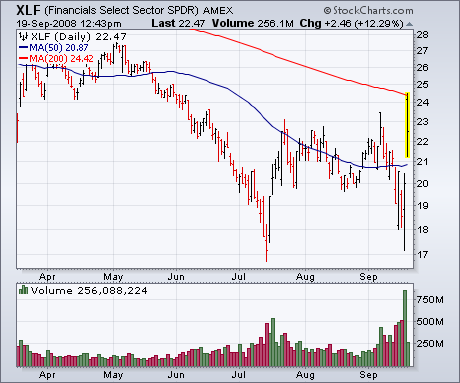
A massive government rescue plan and a temporary ban on short selling has boosted the Financials Sector SPDR by nearly 12% (Chart 1). It's the day's strongest sector on a day when all sectors are in the black. Brokers (not shown) are up 12% and banks nearly a similar amount... Read More
ChartWatchers September 06, 2008 at 10:05 PM
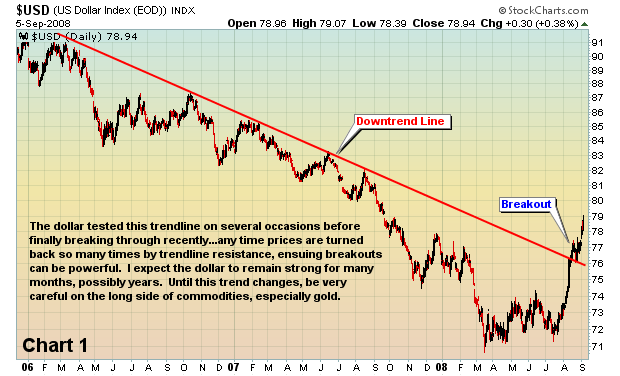
The U.S. dollar couldn't move lower forever. It had to turn and when it did, we knew things might get ugly for commodities. Since the July 14th low in the dollar index, we've seen the greenback rise over 10% (see Chart 1). That has sent commodity prices reeling... Read More
ChartWatchers September 06, 2008 at 10:04 PM
Stocks opened weak after Friday's employment report, but the bulls found their footing late morning and rallied for a mixed close... Read More
ChartWatchers September 06, 2008 at 10:03 PM
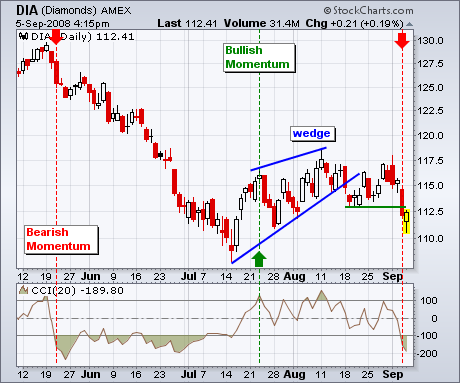
On August 15 I wrote an article pointing out that an ascending wedge had formed on the S&P 500 chart. I noted that this is a bearish formation, and that the most likely resolution would be a breakdown from the wedge followed by a price correction... Read More
ChartWatchers September 06, 2008 at 10:02 PM
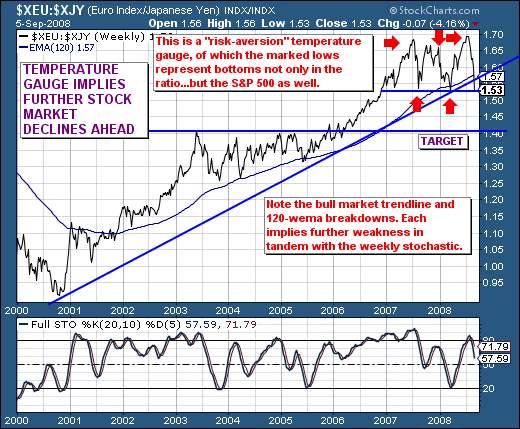
The world's temperature gauge for risk is what we refer to as the "carry-trade" indicator...or the Euro/Yen Spread. When this spread is rising, then the world is said to be putting the carry-trade on and expanding risk profiles; conversely, when the spread is falling..... Read More
ChartWatchers September 06, 2008 at 10:00 PM
How high is "too high?" How low is "too low?" Think back to any time that you've owned a stock and think about when you started to get worried about it's performance... Read More