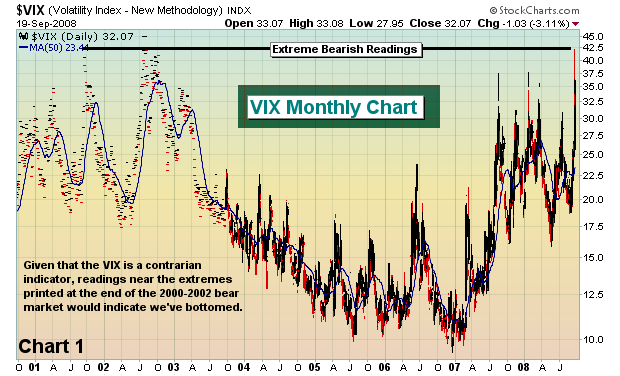
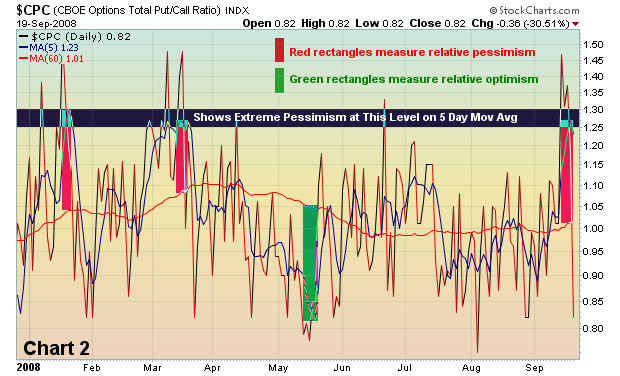
Market bottoms come in all shapes and sizes, but most have a few key ingredients. Without exception, critical market bottoms are borne out of excessive fear and panic. On Thursday, the VIX shot past 42. The last time we've seen the VIX that high, we were carving out the bottom of the 2000-2002 bear market (Chart 1). The equity only put call ratio touched 1.18 on Monday, signaling panic amongst retail investors. The 5 day moving average of the equity only put call ratio hit .95, exceeded only by the reading of 1.01 on March 17th - that was the day the market also saw a very significant bottom. I like to also measure the 5 day moving average of the total put call ratio and plot that against the 60 day moving avg to determine "relative" pessimism and optimism. As the spread between the two widens to extreme levels, bottoms and tops are formed in the market. The total put call ratio is highlighted in Chart 2.
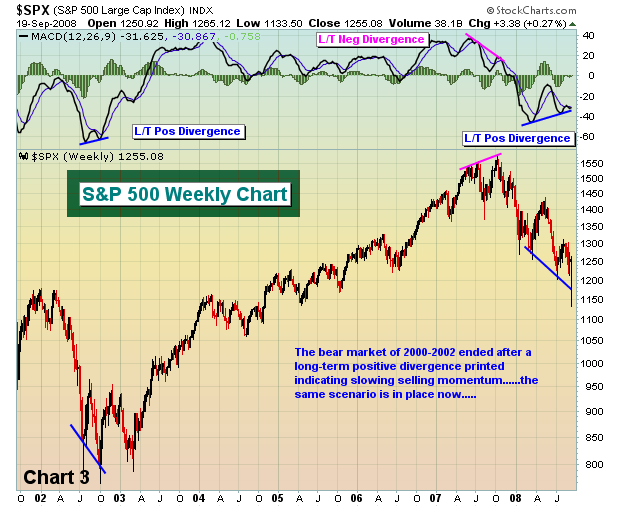
Why is this bottom different? I believe it's different because it's confirmed by a long-term positive divergence on the S&P 500 weekly chart (Chart 3). Positive and negative divergences on the WEEKLY charts appear infrequently. It's an advance sign that long-term selling momentum is waning (in the case of a positive divergence). A negative divergence implies that the long-term buying momentum is slowing. Chart 3 below provides a few excellent examples.
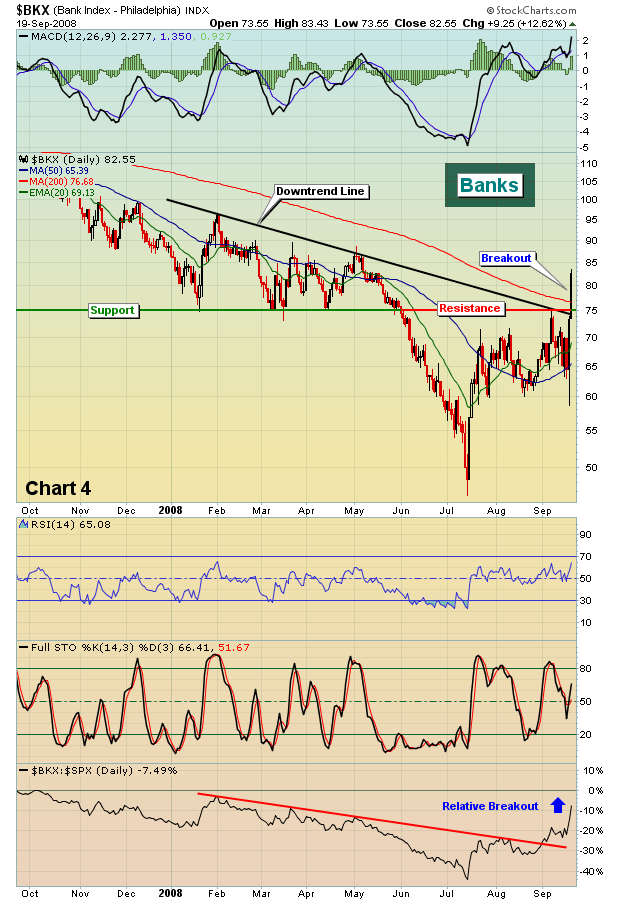
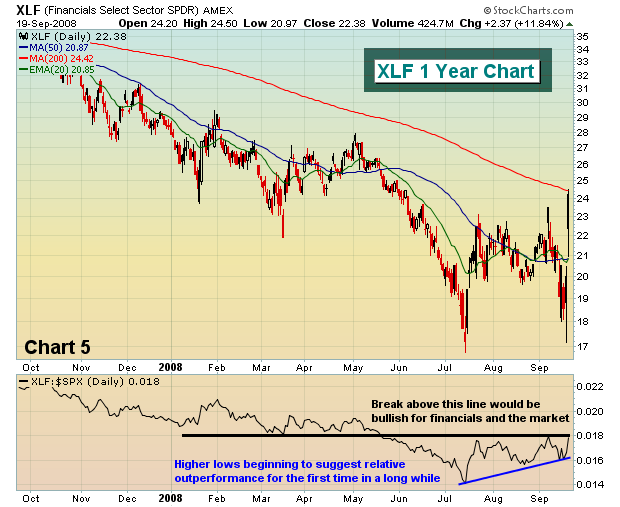
One group that must lead us out of the mess we've been in is the financials. On Friday, the bank index broke out above critical resistance - toppling both its recent downtrend line and also significant price resistance at 75 (Chart 4). The relative strength of financials has been on the improve for the last few weeks and that bodes well for the longer-term health of the market (Chart 5).
Of course, I cannot end this week's look at the market without a quick snippet about max pain. We just witnessed perhaps the most manipulated market behavior ever this week, and it's totally legal. At a time when financials needed help in the worst way, our government announced a resolution trust-type entity AND banned shorting financials until October 2. While the SEC absolutely should focus attention on naked shorting, I was shocked to see our government take a step away from a free market society by not allowing the shorting of financial shares, even if just for a brief period of time. Not only was it unfair - without any warning - but it violently manipulated the stock market the day before options expiration. Let me provide you a few facts as they existed at 1pm EST on Thursday afternoon. The SPY (ETF tracking the S&P 500) was trading at $113.80. The max pain on the SPY was $127.06. The amount of net in-the-money put premium totaled $1.95 BILLION!!!! After the rally Thursday afternoon and the massive gap up on Friday morning, the SPY opened at 126.70. $1.95 BILLION SAVED! Ring the register!
There were many more examples, but let me give you just one more. Goldman Sachs (GS), which had fallen to $86.85 on Thursday at its low, rallied to open on Friday morning at $142.51. Max pain was near $141.00. MILLIONS SAVED! Ring the register. Imagine the impact this had across all stock, ETF and index options. Rest assured it saved key financial institutions billions and billions of dollars.
If you haven't had a chance to listen to our max pain presentation, it is archived on our home page and it's FREE. It's well worth the hour or so to learn more about max pain and its impact on short-term market direction. As a bonus, it includes a discussion regarding The Bowley Trend and how you can benefit from historical market trends.
Have a great week and happy trading!


