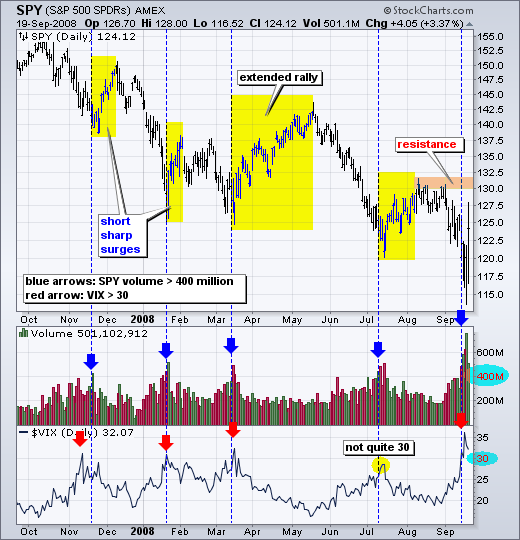
Volume and volatility surges foreshadowed bear market rallies in November, January and March. Both surged again this week and the market took notice with a huge bounce over the last two days. The chart below shows the S&P 500 ETF (SPY) with volume and the S&P 500 Volatility Index ($VIX). The blue arrows show volume surges above 400 million shares, while the red arrows show VIX surges above 30. A volume surge after an extended decline reflects a selling climax or capitulation that exhausts selling pressure. Similarly,a VIX surge above 30 reflects excessive bearishness that can lead to a rally. Of note, the VIX fell just short of the 30 threshold in July, but SPY volume surpassed the 400 million mark. Even though this pairing is not perfect, it is still helpful in identifying the confluence of excessive bearishness and capitulation. With a surge over the last two days, a bounce is clearly underway. Unfortunately, there is no way to tell how long the bounce will last or how far it will extend. The November and January bounces were short-sharp affairs that lasted just 2 weeks. In contrast, the March advance lasted two months and the July rally lasted a month. One thing is for sure, there is a ton of resistance around 130-132.
There is also a video version of the this analysis available at TDTrader.com - Click Here.


