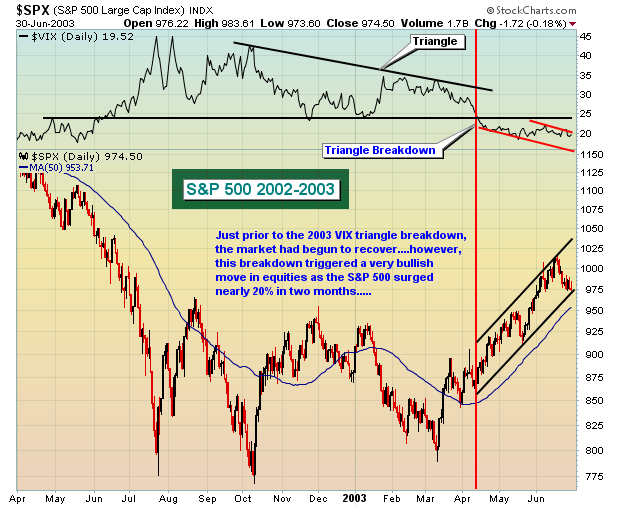
In my last article, I noted that I was "undeniably bullish". I can tell you that nothing occurred these last two weeks to change my mind. More and more corroborating technicals have lined up to suggest this current rally has legs. Perhaps the most important of them all was the triangle breakdown on the VIX. The first chart below highlights the triangle that developed on the VIX during the 2000-2002 bear market and the subsequent breakdown of that triangle and how the S&P 500 surged higher following the breakdown:
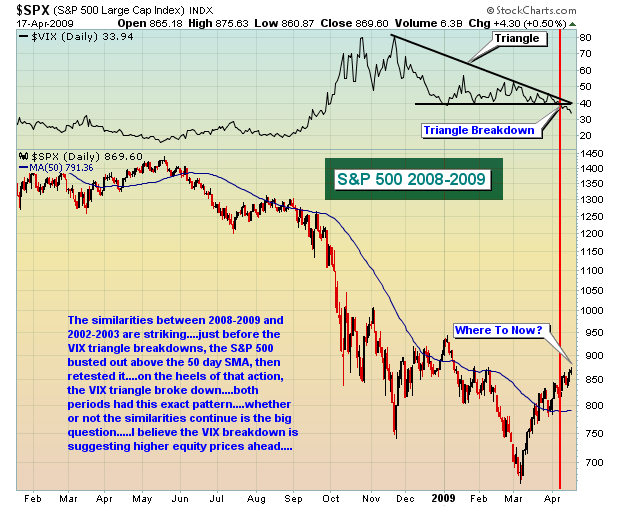
From the moment the VIX broke down, the major indices began rallying. And the rally lasted for quite some time, with few pullbacks along the way. Last week, the VIX broke below triangle support at 38 or so, then broke down below long-term price support at 36. The question now becomes - will the major indices rally off of this breakdown as they did in 2003? I believe they will. Take a look below at the setup of the market as the VIX breaks down from a triangle pattern once again:
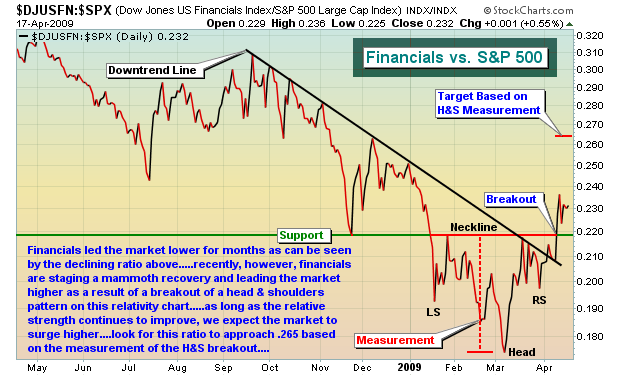
The sectors that need to lead the market higher out of bear market territory are doing so. Financials, technology (semiconductors in particular), transportation, consumer discretionary - these are the groups we want to see moving higher. Check out the relative strength in financials:
It's important to recognize that market conditions have changed. That suggests you should change your trading strategies as well. Let me give you an example of how we've operated. From October 1st through March 22nd, we alerted only 10 individual stocks, instead shifting to more conservative and less volatile ETFs. During the same period, we alerted 24 ETFs. We were in capital preservation mode, only risking capital when it seemed appropriate. Over the last three weeks, we have alerted 25 individual stocks and 0 ETFs. It's not that we don't like ETFs, we simply believe trading ETFs lowers returns in an environment where individual stocks are thriving on the long side. Trade the best stocks within the best sectors, timing entry and exit points based on technical support and resistance levels. Many technical indicators were useless for several months while emotional trading ran wild. That has changed and technicals are now back in style and much more reliable. To see the stocks we've traded, click here.
I would like to encourage those of you who trade "juiced" sector and index ETF's (eg, SKF, UYG, SRS, URE, etc) to review an earlier video presentation that details many of the common pitfalls of the juiced ETF trader. Two items should be kept in mind at all times. First, these juiced ETFs are designed to do their jobs for ONE DAY only. They lose value over time similar to options (though not to the same degree). Secondly, determine entry and exit points on the juiced ETFs based on your technical analysis of the underlying index. Too many traders look at the charts of the juiced ETFs themselves, searching for key support and resistance levels, or trading them on 20 day EMA tests or 50 day SMA tests. That approach will not work with any consistency because of what's been mentioned above. To view this presentation, click here.
Happy trading!


