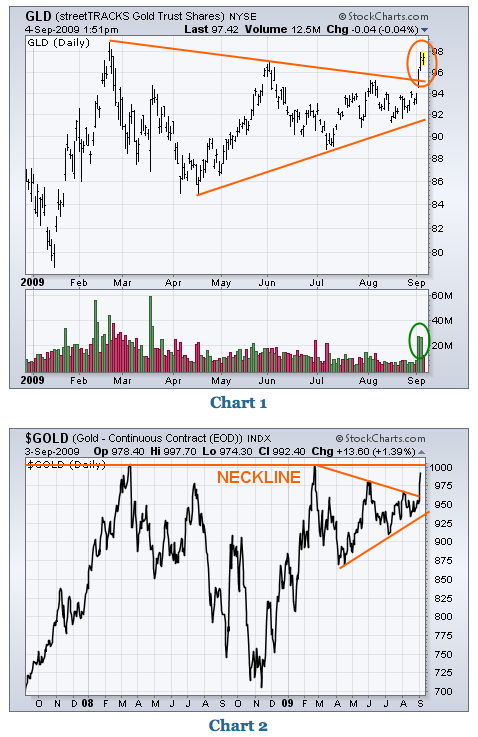
GOLD TESTING ALL-TIME HIGH... Last Friday I wrote about the bullish potential in gold and gold shares. That optimism was based on two bullish chart patterns which are shown below. The first is the bullish symmetrical triangle shown in Chart 1 for the Gold Trust ETF (GLD). This week's upside break of the upper resistance line (on heavy volume) is bullish and signals a test of its February high near 100 (which corresponds to $1,000 in bullion). Chart 2 shows why that's an important resistance level of its own. Chart 2 (based on the price of bullion) shows an inverse (or continuation) head and shoulders pattern with a neckline drawn over gold's 2008-2009 highs. A close through that level (which appears likely) would be even more bullish for gold and gold shares. In fact, gold shares have risen even more than bullion this past week. So did silver.


