Before getting into this breadth thrust, let's review the McClellan Oscillator and McClellan Summation Index. Basically, the McClellan Oscillator is the 19-day EMA of Net Advances less the 39-day EMA of Net Advances (advances less declines). Like MACD, it is a momentum oscillator for Net Advances. The McClellan Summation Index is a cumulative measure of the McClellan Oscillator. The summation index rises when the Oscillator is positive and falls when the Oscillator is negative.

Click this image for details
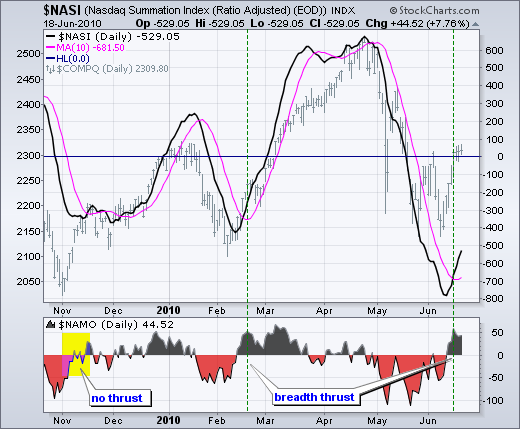
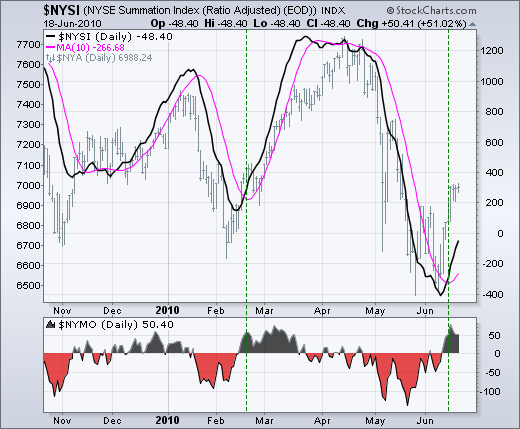
The chart above shows the Nasdaq McClellan Oscillator ($NAMO) in the lower indicator window. Notice how the oscillator surged from below -50 to above +50. This 100+ point swing from negative territory to positive territory is a bullish breadth thrust. A similar bullish thrust occurred in February. The main window shows the Nasdaq McClellan Summation Index ($NASI). Notice how it declined steadily from late April to early June as the McClellan Oscillator remained consistently negative. The bullish breadth thrust in the McClellan Oscillator pushed the Summation Index above its 10-day SMA for the first time since late April. The chart below shows the NYSE McClellan Oscillator and Summation Index for reference. You can click on these chart to see the settings.

Click this image for details

Click this image for details
The chart above shows the Nasdaq McClellan Oscillator ($NAMO) in the lower indicator window. Notice how the oscillator surged from below -50 to above +50. This 100+ point swing from negative territory to positive territory is a bullish breadth thrust. A similar bullish thrust occurred in February. The main window shows the Nasdaq McClellan Summation Index ($NASI). Notice how it declined steadily from late April to early June as the McClellan Oscillator remained consistently negative. The bullish breadth thrust in the McClellan Oscillator pushed the Summation Index above its 10-day SMA for the first time since late April. The chart below shows the NYSE McClellan Oscillator and Summation Index for reference. You can click on these chart to see the settings.

Click this image for details

About the author:
Arthur Hill, CMT, is the Chief Technical Strategist at TrendInvestorPro.com. Focusing predominantly on US equities and ETFs, his systematic approach of identifying trend, finding signals within the trend, and setting key price levels has made him an esteemed market technician. Arthur has written articles for numerous financial publications including Barrons and Stocks & Commodities Magazine. In addition to his Chartered Market Technician (CMT) designation, he holds an MBA from the Cass Business School at City University in London.
Learn More


