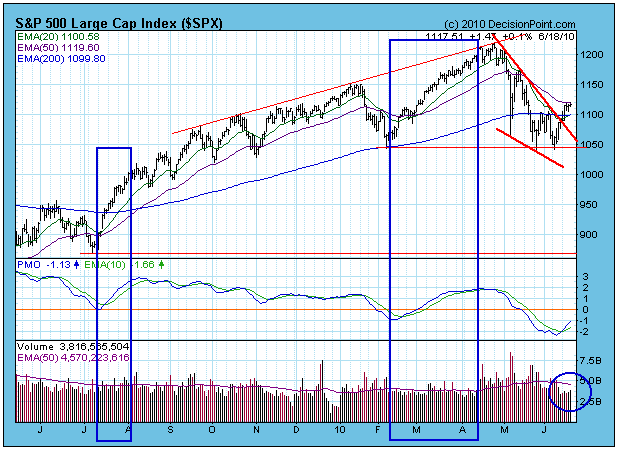
One of the issues that has concerned many analysts is the lack of volume supporting the rally from the June lows, but looking back over the last year we can see that volume has not been at all impressive for either of the rallies beginning in July 2009 or February 2010. This is a great illustration of why we do not use a volume or breadth component in our primary timing models. In my opinion, only price movement is relevant when a decision point appears to be at hand.

This does not mean that we don't use volume and breadth indicators as secondary tools to further assess what price is telling us, and to dig deeper than the raw volume bars, which since the beginning of the bull market have not shown enthusiastic support.
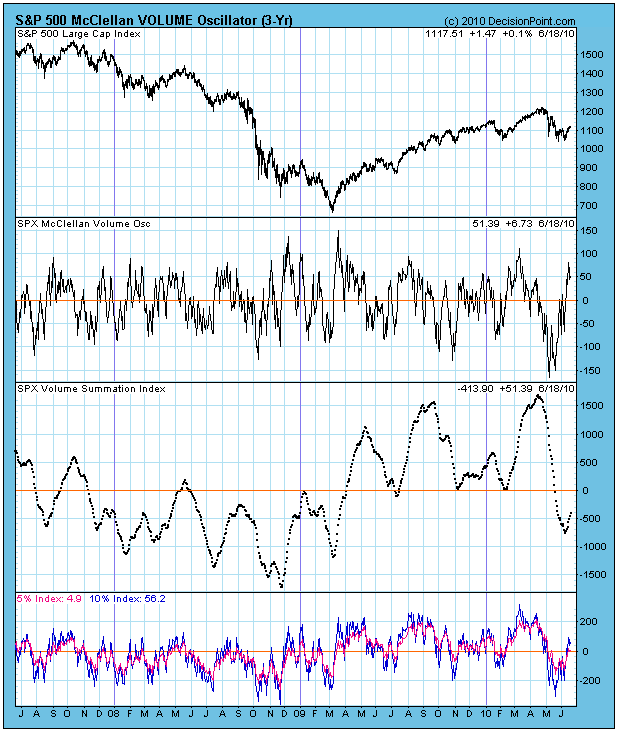
One of the tools we use is the McClellan VOLUME Oscillator, which is calculated the same as the McClellan Oscillator except that we use daily advancing and declining volume instead of advances and declines. The core element of the Oscillator's construction is to calculate a fast and slow exponential moving average of the daily advancing volume minus declining volume. These moving averages are displayed below as the 5% and 10% Indexes. Subtracting the 5% Index from the 10% Index results in the McClellan Volume Oscillator reading. The cumulative total of the daily Oscillator reading gives us the Volume Summation Index.

While the raw volume has been pretty consistently below average throughout the bull market, it is what it is, and prices have been rising. The Volume Oscillator and its components allow us to view the internal quality if that volume. The convergence and divergence of the two moving averages expresses the short-term momentum of advance-decline volume through the Oscillator, and the Summation Index presents a medium-term view.
What we see are fairly usual index/indicator formations and ranges. The exception being that the recent correction brought the 5/10% Index complex more deeply below the zero line than is typical for a bull market (or bear market, for that matter).
The recovery out of the recent lows looks normal and healthy. The 5/10% Indexes are back above the zero line, which is where they need to be in a bull market, and the Summation Index has bottomed, although it is still below zero. The Oscillator is in the overbought range, which is a problem for the short-term.
Summary: While raw volume continues to be a problem, looking below the surface shows that advance-decline volume relationships and behavior are normal, and in general support a bullish outlook.


