ChartWatchers August 21, 2011 at 10:11 PM

Hello Fellow ChartWatchers! Last week, we hosted over 300 enthusiastic StockCharts.com members here in Seattle for ChartCon 2011. John, Arthur and myself cannot say enough about the great people we met. Thanks again to everyone that participated... Read More
ChartWatchers August 20, 2011 at 05:01 PM
If the stock market were a mental health patient, it would have been committed by now. Major trend changes are occurring at points of wild volatility and extreme fear... Read More
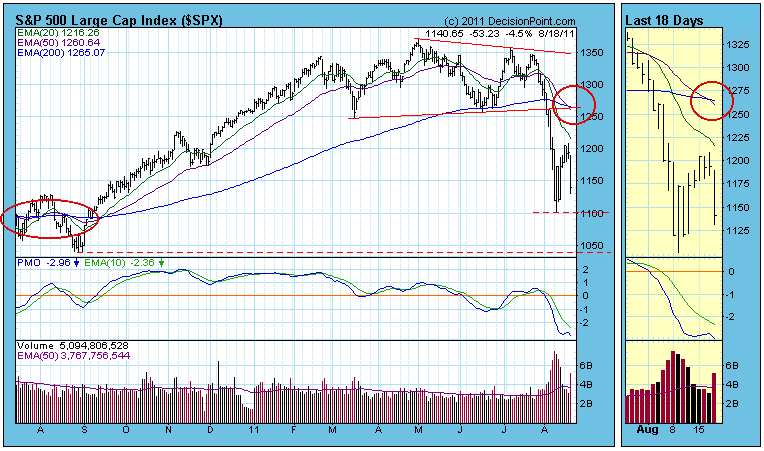
ChartWatchers August 20, 2011 at 04:57 PM
The recent volatility is enough to make one step back, put your money aside - and reassess... Read More
ChartWatchers August 20, 2011 at 04:51 PM
On 8/2/2011 our mechanical Thrust/Trend Model generated a medium-term NEUTRAL signal for the S&P 500 Index just in time to avoid the market break on 8/4. (Neutral means to be market neutral -- in cash or fully hedged... Read More
ChartWatchers August 20, 2011 at 08:07 AM
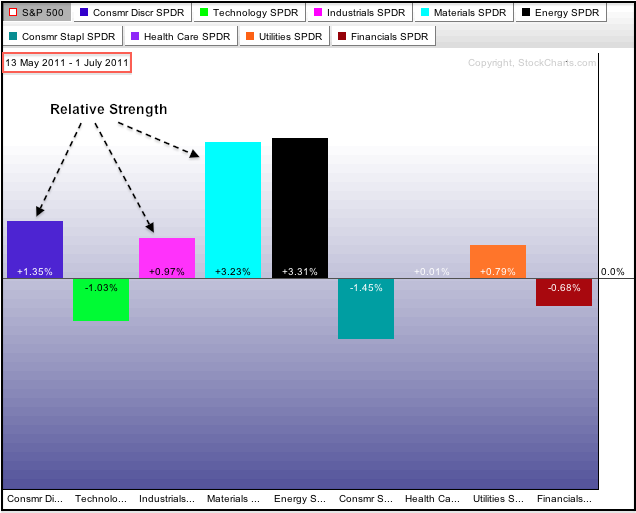
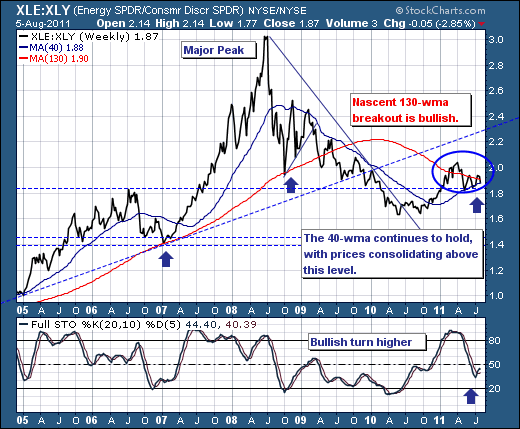
Selling pressure since July 1st pushed the Consumer Discretionary SPDR (XLY) from a market leader to a market laggard. These Sector PerfCharts show the performance for the nine sector SPDRs relative to the S&P 500... Read More
ChartWatchers August 19, 2011 at 08:00 PM
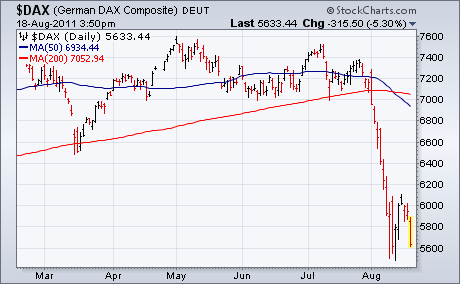
A 5% drop in German stocks is contributing to heavy selling in Europe which has spread to the U.S. Chart 1 shows the German DAX falling 5.3% to make it Europe's biggest loser. Most other European stocks are down 4%... Read More
ChartWatchers August 07, 2011 at 12:29 AM
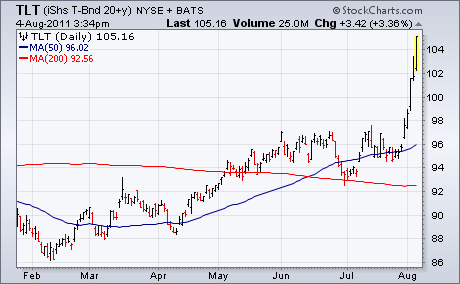
With global stocks and commodities in a rout, most U.S. bonds are surging again. Chart 1 shows the T-Bond 20+Year iShares (TLT) continuing its recent surge (as bond yields tumble to the lowest level in a year). The only exception is high yield corporates... Read More
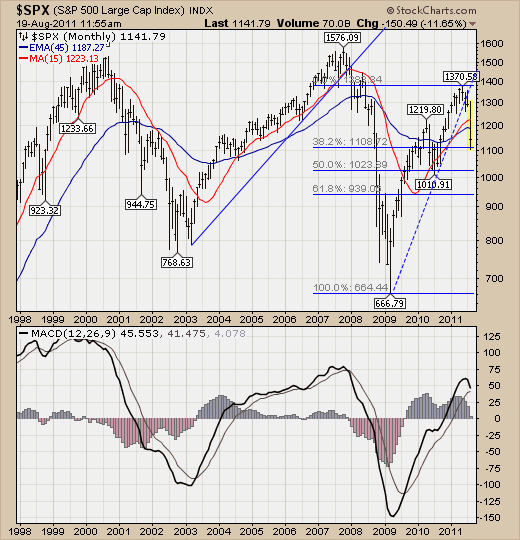
ChartWatchers August 07, 2011 at 12:25 AM
Last week, and so far this week the stock market has traded rather dismal to be sure, with the S&P 500 trading lower in 8 of the past 9 trading sessions... Read More
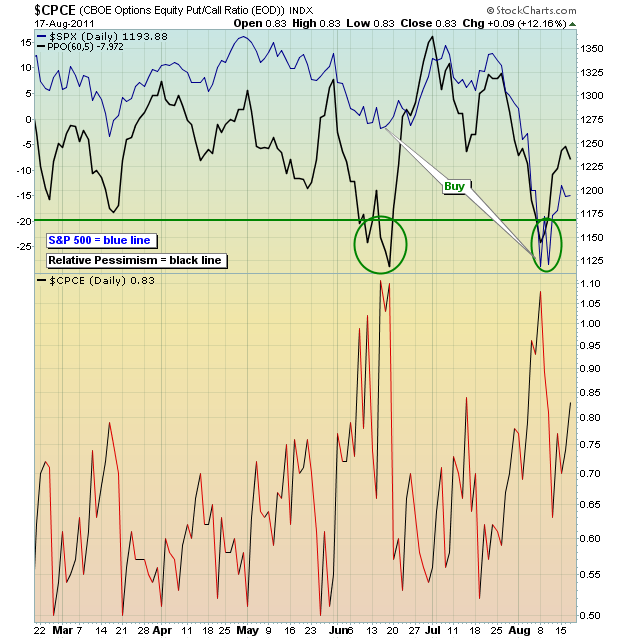
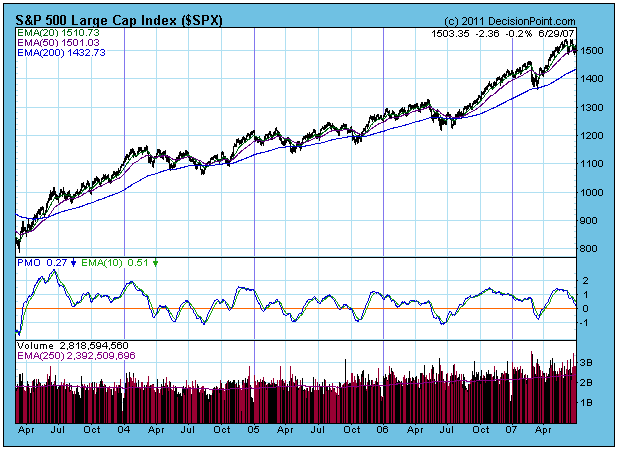
ChartWatchers August 07, 2011 at 12:19 AM
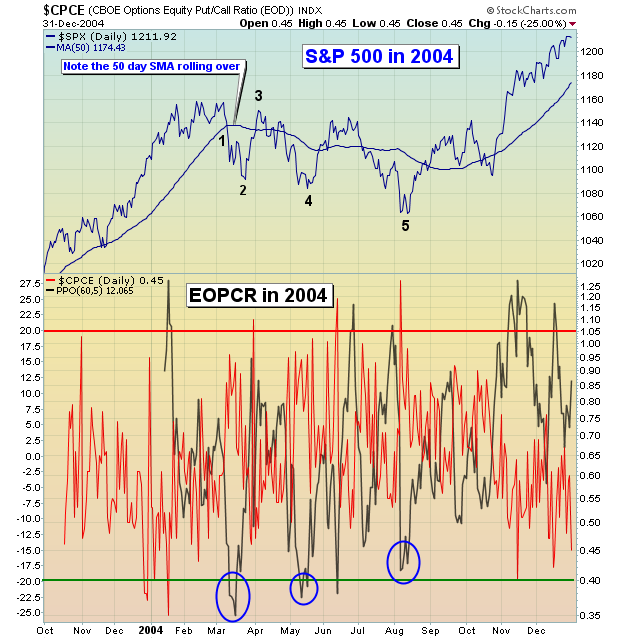
If you recall, stocks were mired in an ugly bear market from 2000 through 2002. At the end of that bear market, however, the S&P 500 staged a huge advance, running specifically from 789 in March of 2003 to 1163 by March 2004... Read More
ChartWatchers August 06, 2011 at 03:50 PM
READER COMMENT: I have written to you before regarding your comments on volume ("where is the volume?") which imply that volume "confirms" a move. To me, like many others, volume no longer means anything, or at least not what it used to mean... Read More
ChartWatchers August 06, 2011 at 03:09 PM
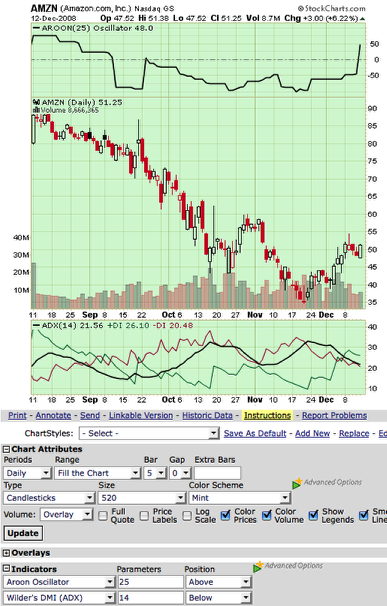
Hello Fellow ChartWatchers! ChartStyles are basically "templates" of charts. They contain everything about the chart except the ticker symbol. Members of our Basic and Extra services can save multiple ChartStyles into their accounts for quick access later... Read More
ChartWatchers August 05, 2011 at 07:41 PM
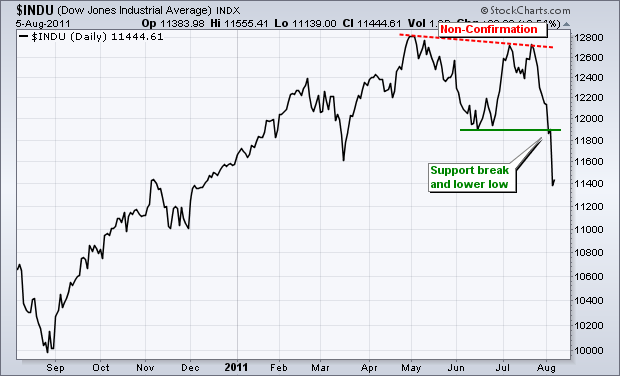
Based on the writings of Charles Dow, Dow Theory utilizes the Dow Industrials and Dow Transports to generate buy and sell signals for the broader market. The market trend is up when both forge higher highs. The market trend is down when both forge lower lows... Read More