ChartWatchers December 17, 2011 at 08:09 PM
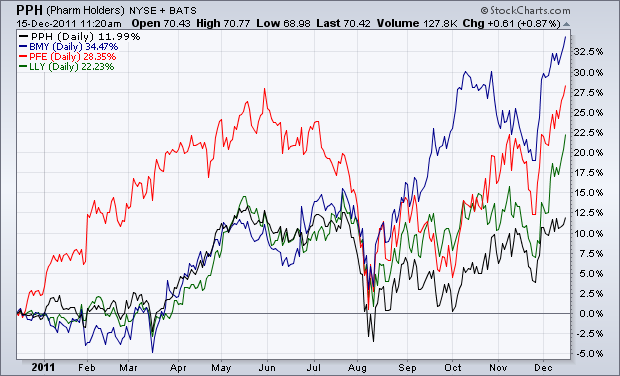
The chart below shows the three strongest drug stocks in the PPH this year. All three have recently achieved upside breakouts. They include Bristol Myers (blue line), Pfizer (red line), and Eli Lilly (green line). The black line is the PPH... Read More
ChartWatchers December 17, 2011 at 07:58 PM
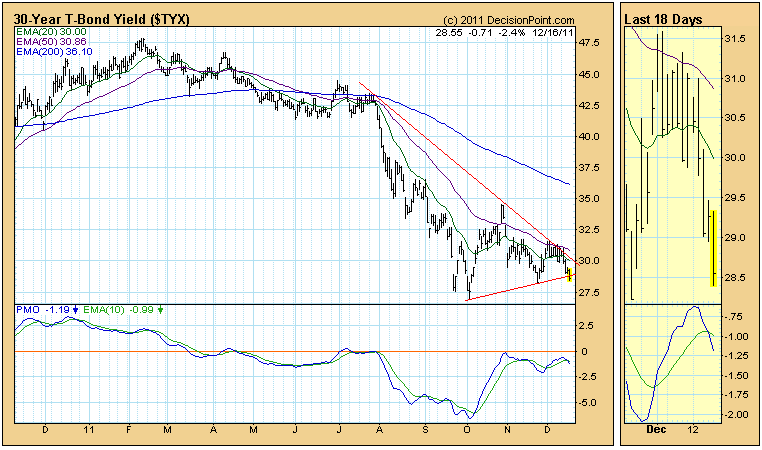
The 30-year bond yield has dropped below three percent many times this year, dropping as low as 2.694% in October. It has been trending up since then, but today it looks as if the October low could be retested... Read More
ChartWatchers December 17, 2011 at 07:54 PM
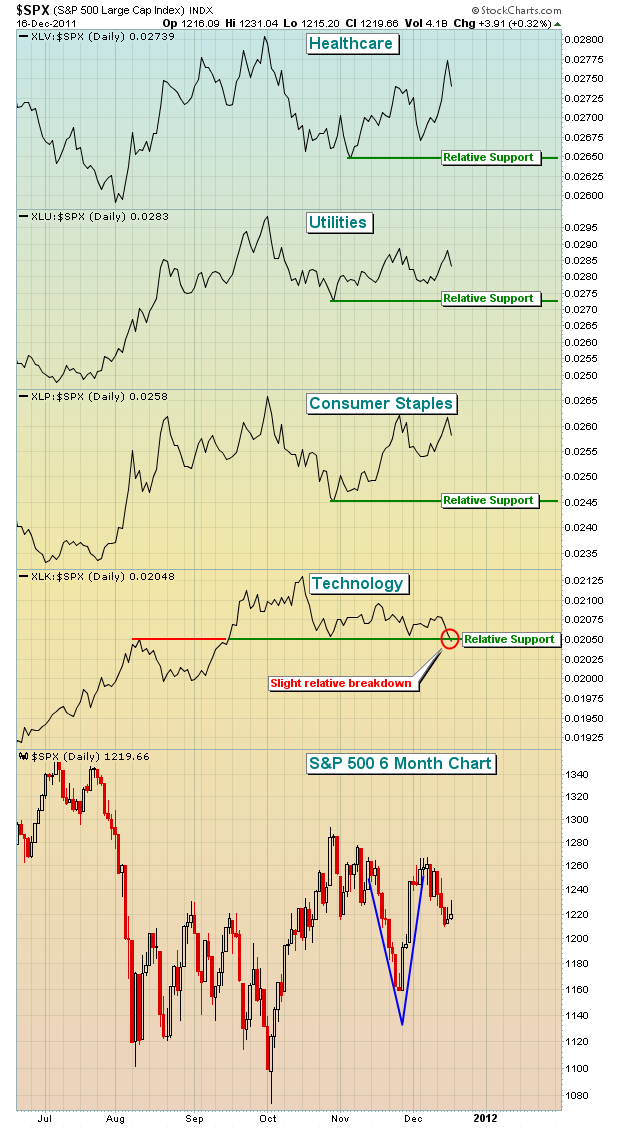
I always find myself turning my attention to "next year" in the stock market as we enter the December holiday season. On many fronts, 2011 has been the most challenging year in equities that I've ever seen... Read More
ChartWatchers December 17, 2011 at 10:23 AM
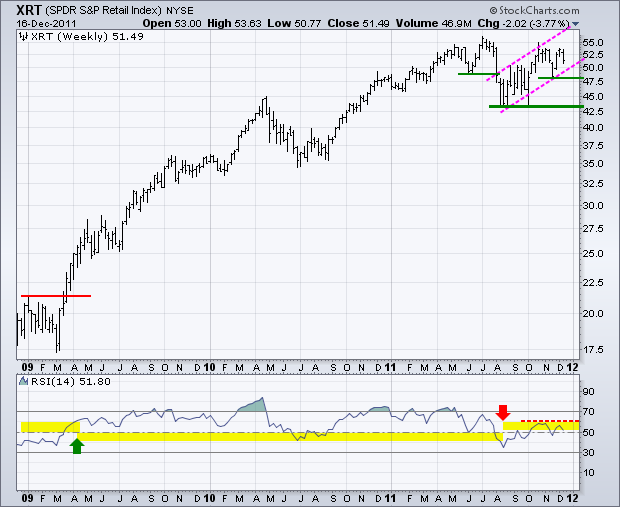
The Retail SPDR (XRT) remains one of the strongest ETFs in the market. As a core part of the consumer discretionary sector, retail is one of the most important industry groups and Christmas is perhaps the most important season. A lot is riding on the consumer this holiday season... Read More
ChartWatchers December 03, 2011 at 09:06 PM
Hello Fellow ChartWatchers! First off I wanted to make sure you knew that our Holiday Special is now underway! Long time members will tell you that if you are a StockCharts fan, the best time to join or renew is during our Holiday Sale Special... Read More
ChartWatchers December 03, 2011 at 07:58 PM
ANNOUNCING SCTRs, AN IMPORTANT NEW TOOL FOR CHART WATCHERS - Stock ranking systems are nothing new. Investors Business Daily has had their well-known RS Rank system in place for years... Read More
ChartWatchers December 03, 2011 at 04:45 PM

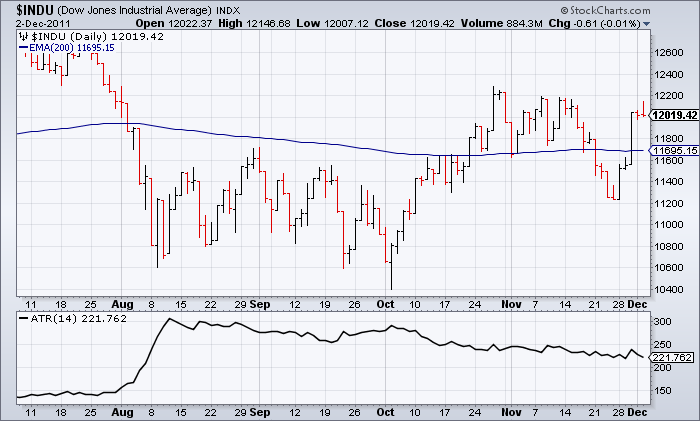
STOCK RALLY STALLS AT 200-DAY AVERAGE... This past week's impressive stock rally ran into some profit-taking on Friday just shy of 200-day moving averages... Read More
ChartWatchers December 03, 2011 at 04:22 PM
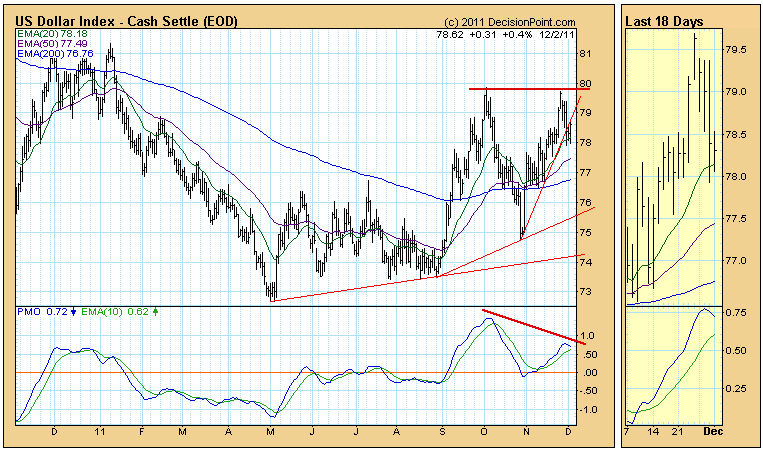
The US Dollar Index appears to be setting up for a medium-term double top. This week it broke down through a short-term rising trend line drawn from the October low after reaching a level equal to the October top. The PMO made a lower top, creating a negative divergence... Read More
ChartWatchers December 03, 2011 at 04:16 PM
Last week, the world's stock markets cheered the coordinated central bank efforts to supply dollar liquidity to the world banking system via lower than market rates... Read More
ChartWatchers December 03, 2011 at 04:12 PM
With one week left to go, the S&P 500 was on the verge of its worst November in the last sixty years. Then the Fed and other central bankers came to the rescue of global markets last week and everything was just peachy again (sarcasm intended)... Read More
ChartWatchers December 03, 2011 at 12:26 PM
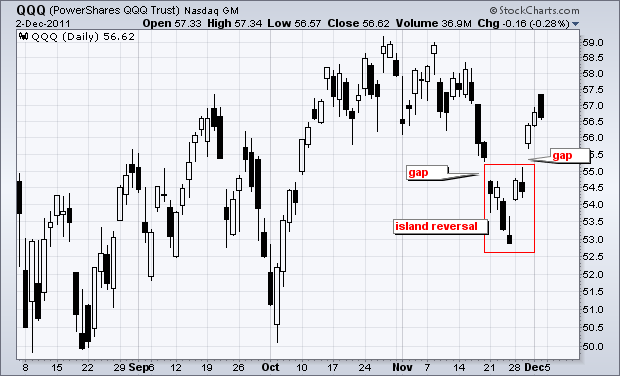
While gaps are not what they used to be, there were a few island reversals on the charts this week. The chart below shows the Nasdaq 100 ETF (QQQ) with a large island reversal over the last three weeks... Read More