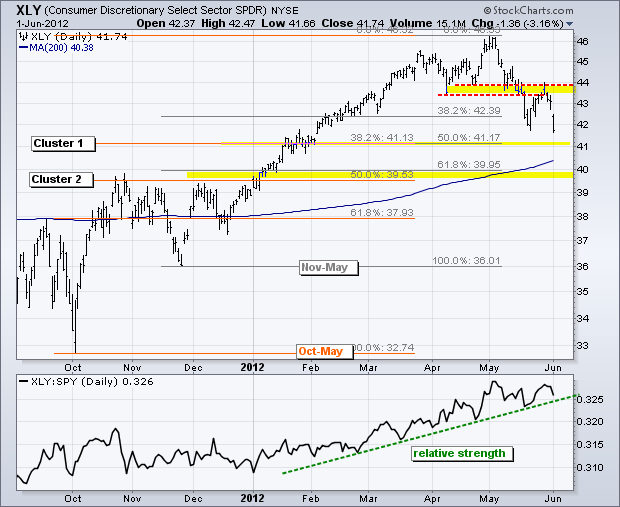
After a failure at broken support, the Consumer Discretionary SPDR (XLY) looks set for a move towards a Fibonacci cluster. The chart below shows XLY breaking support and becoming oversold in mid May. The ETF then bounced back to broken support and this area turned into resistance. It is not uncommon to see such a "throwback" bounce, especially after becoming oversold. This bounce alleviated oversold conditions and this week's decline signals a continuation of the May decline.
Click this image for a live chart.
With a continuation signaled, it is time to start thinking about potential supports and downside targets. The first target resides around 41 and the other in the 39.5 area. I am using the Fibonacci cluster for these targets because there are two lows and one distinct high. The orange Fibonacci Retracements Tool extends from the October low to the May high. The gray Fibonacci Retracements Tool extends from the November low to the May high. I then look for clusters or where the two retracements closely overlap. The current decline off broken support looks quite strong and this leads me to believe that XLY will hit the lower cluster in the 39.5-40 area. Also notice that the 200-day moving average is right between tehse two clusers. You can read more about Fibonacci levels in our ChartSchool article.
Good trading,
Arthur Hill CMT


