Commodity countries have been trying to find a bid for a while.
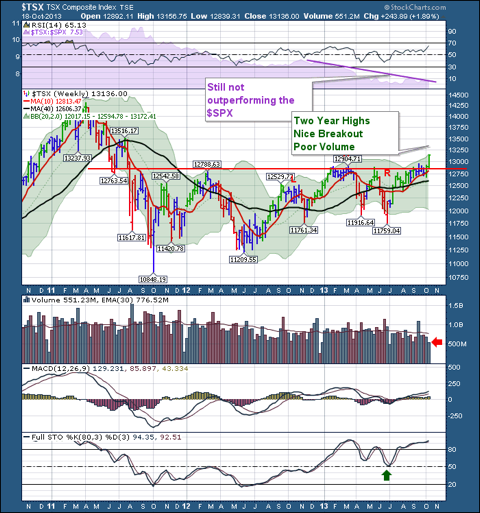
This week, Toronto closed at 2 year highs, well above resistance.This is the first close above 13000 in 2 years.
The link is here. $TSX
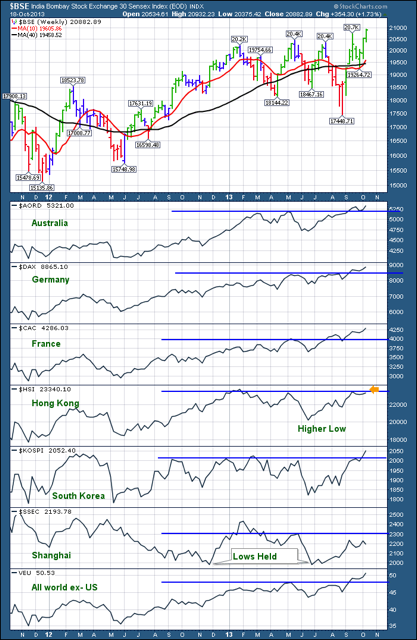
Here is a chart of other major indexes breaking out. Live link for the global breakout.
India has pushed above 4 similar highs this year. Australia broke out in September with Germany and France. Korea moved above in October. Italy and Spain (not shown) have also broken out to the upside. The All World Vanguard fund shown at the bottom has broken out. Two interesting charts are the Hang Seng ($HSI) and Shanghai ($SSEC).
The Hong Kong Hang Seng is testing the May highs after making a higher low compared to last year. I would expect it to finally break out here. That chart looks more like an uptrend.
The Shanghai is still in a downtrend. The only encouraging thing on the chart is that the lows of 2012 were not taken out this year. Support held. $SSEC does not have far to move to break out and I would be thrilled to see it break the downtrend. Especially for the global commodity demand, that would be exciting.
Charts like England and Japan still have work to do and they are important globally. Brazil and Russia are both interesting. Brazil and Russia have pushed above downward sloping trend lines.
Russia has taken out the May highs, whereas Brazil has not. Having the four Commodity horsemen (Australia, Brazil, Canada and Russia) breaking out would confirm a major breakout.
There is an old saying. "When you are breaking out to new highs, you are not in a downtrend." When the globe is breaking out to new highs, we are probably breaking out into a big new global bull market. One week doesn't make a conclusion, but it can be the beginning of a multi year breakout. That appears to have happened this week on many exchanges. I'll be focused on watching to make sure it holds up. The extremely light volume on the $TSX chart is not a ringing endorsement, but investors are willing to pay higher prices in a quiet market. Canada was closed for Thanksgiving on Monday, so that explains some of the reduction. The price action is still bullish.
Good Trading,
Greg Schnell, CMT


