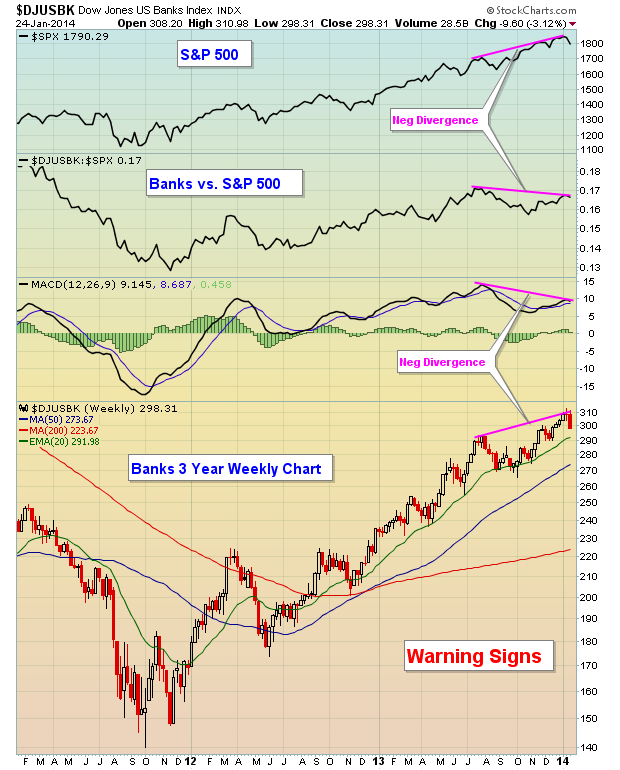
This bull market has been humming along since March 2009, but we cannot ignore the storm clouds building on the horizon. The technical conditions have slowly deteriorated with the highly influential banking industry ($DJUSBK) reversing hard last week with a long-term negative divergence present on its weekly chart. Those weekly negative divergences tend to be much more significant than those found on daily or intraday charts. Have a look at the momentum issue:
You'll notice two things on this chart. First, as prices on the DJUSBK move higher on the weekly chart, the MACD is actually moving lower, reflecting the convergence of the 12 week and 26 week EMAs. This tells us that longer-term momentum on the buy side is slowing. The other thing this chart tells us is that the bull market rally was being led by banks all the way through late summer. That has changed and the latest overall rally by the S&P 500 actually saw banks underperform on a relative basis - a form of a negative divergence and this is generally a warning sign in my view.
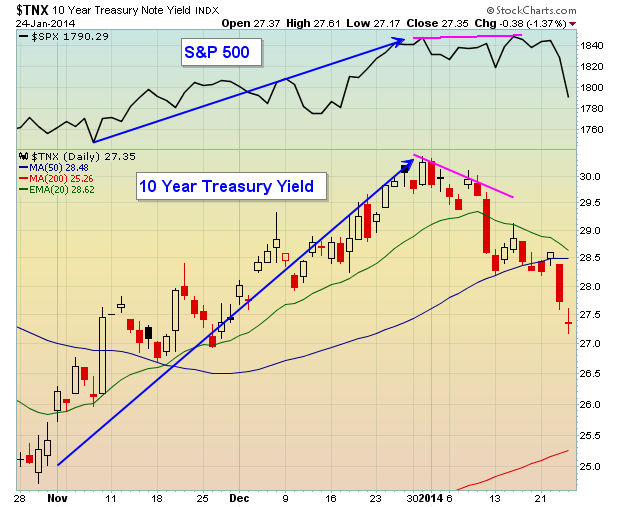
I also view the bond market to be much smarter than the stock market. If you look back at history, you'll see that the 10 year treasury yield and the S&P 500 tend to trend in the same direction. Temporarily, during quantitative easing, that relationship changed and the two moved inversely to one another. But over time, they've tended to trend together. You'll find that many times the 10 year treasury yield ($TNX) will change directions ahead of the S&P 500, providing us a hint of upcoming weakness in equities. That's what happened in early January. Take a look:
The reason for this relationship is quite simple. Traders and investors have a choice to make where to put their money - either in more conservative bonds ahead of an economic slowdown OR in more aggressive equities to take advantage of an expanding economy. The mentality of traders has changed over the past few weeks, especially on the heels of that awful jobs report a couple weeks ago. This could be just a temporary setback and there are plenty of reasons to remain optimistic about equities.
I can tell you one thing, though. History is NOT on the side of the bulls right now. Since 1950, stock market performance from February 1st through December 31st is HIGHLY correlated to January performance within the same year. It's that old Wall Street adage "as goes January, so goes the year". The S&P 500 is currently down 3.14% year to date. We still have a week to go in January, but if the S&P 500 ends January where it is right now, it would place January 2014 in the bottom quartile of all January's since 1950. Since 1950, January has been lower 24 times. Of those 24 years, half have been flat or lower over the next 11 months and the AVERAGE balance of year returns for those negative January years is -0.16%.
That's not a lot to look forward to.
On Tuesday evening, I will be hosting a webinar, "The January Effect", where I'll delve into history and how it's been shown to impact the direction of future equity prices. For anyone interested, CLICK HERE for details.
Happy trading!
Tom Bowley
Chief Market Strategist/Chief Equity Strategist
Invested Central/EarningsBeats.com


