The NASDAQ has been powering forward off the mid-April lows and one big reason has been the semiconductor industry. The Philadelphia Semiconductor index ($SOX) rose 15% in just a seven week period from May 15th through July 3rd. From there, a severe long-term negative divergence printed and that suggested that the move to the upside - and the momentum - was slowing. In my opinion, these negative divergences are among the most significant technical indications of an impending top and, if nothing else, should suggest that risks are increasing on the long side. Check out the SOX chart as of July 7th:
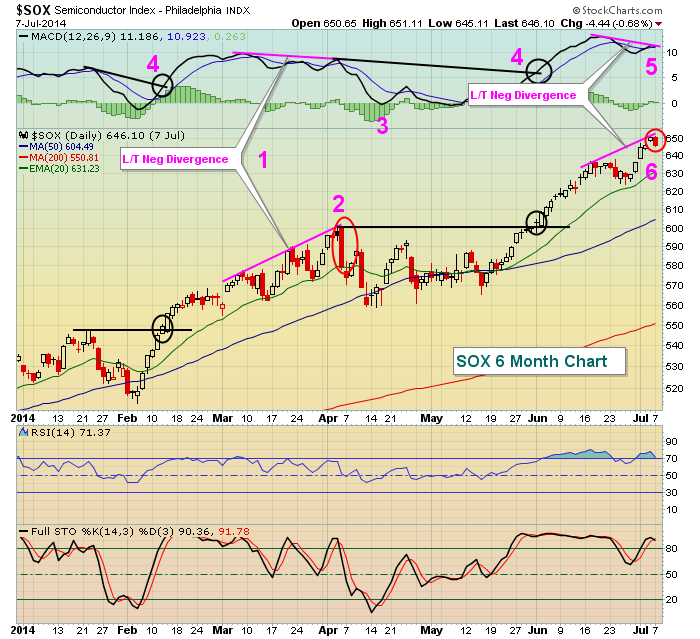
This was a picture of the SOX on July 7th and I've noted 6 different observations. Let's take a look at one at a time:
(1) In early April, we saw the price action on the SOX move higher, but with no confirmation from the MACD. In other words, our moving averages actually started to CONVERGE while prices kept moving higher. This is a long-term negative divergence and it can be quite bearish for a stock or index.
(2) Check out this bearish engulfing candle. Once I see a long-term negative divergence form, I look for confirmation of a potential top with a reversing candlestick. In this case, the bearish engulfing candlestick gave me that. The top of the reversing candle can then be used as a potential stop, defining the monetary risk on a trade (should you decide to short in this case).
(3) After the signs of slowing momentum surface, I look for what I refer to as a "MACD centerline reset" and/or a 50 day SMA test. This doesn't mean that the selling will stop once it gets there. Rather, I just look for a move down to these two levels to "reset" the issues caused by the slowing momentum. Many times a long-term negative divergence can become a long-term top, but there's no way of knowing this until we see how the market reacts after the long-term negative divergence prints.
(4) Notice in February and early June how a long-term negative divergence was technically present when each of these two breakouts occurred? But price action kept moving higher? How could that be? Long-term negative divergences are supposed to indicate slowing momentum, right? Well, a couple things here. First, just before these breakouts we saw MACD centerline tests. At that point, momentum issues have been "reset". In my opinion, it makes no sense to look back to where the MACD was on prior highs because momentum issues have already been resolved. It would have been a costly mistake to short semiconductors on these breakouts. Second, when a stock or index first breaks out to new highs, it's not unusual to see a long-term negative divergence form. But if the price keeps moving up for a few days, the MACD many times will also turn higher and eliminate the negative divergence. That's why I like to see confirmation via a reversing candlestick - especially one with high volume.
(5) This brings us to the long-term negative divergence that formed on the breakout July 1st. Note that the uptrend continued for a few more trading sessions until we saw a reversing candlestick (bearish engulfing). That combination - long-term negative divergence and reversing candlestick - can be lethal and should be respected by traders because of the INCREASED RISK - not because of any GUARANTEE that the price will head lower.
Now here's the rest of the story on the SOX since July 7th:
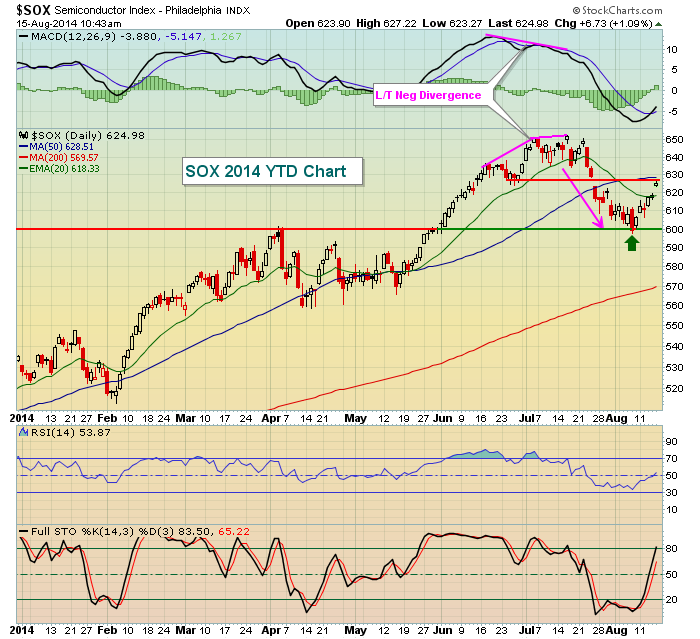
Once again, the long-term negative divergence proved to be pivotal in the subsequent action. While the MACD has moved beneath centerline support, indicative of bearish momentum, it is VERY important to note that the SOX has held price support near 600 (green arrow). If that level is violated, then one of the leading industry groups of 2014 will be on a major sell signal and that would not be good for the continuing bull market.
One day at a time.
ChartCon 2014 was a blast. I enjoyed meeting many of you who were able to take the time to join StockCharts in Seattle last weekend. Great weather, great food, great speakers and a great conference were enjoyed by all. I provided a "thank you" to all those that attended with a FREE 8 part series on Understanding the MACD, which I believe is essential to trading and to gauging momentum. I'd like to extend that offer to all ChartWatchers subscribers and readers. Simply CLICK HERE to claim your FREE video series.
Happy trading!
Tom Bowley
Chief Market Strategist
Invested Central


