After Erin's presentation at ChartCon 2014 many attendees responded positively to learning about the DP Daily Update, which is located in the DP Reports Blog (available to StockCharts EXTRA and above subscribers). The purpose of the DP Daily Update is to quickly review the day's action, internal condition, and Trend Model status of the broad market (S&P 500), the nine SPDR Sectors, the U.S. Dollar, Gold, Crude Oil, and Bonds. To ensure that using this daily reference will be quick and painless, we are as brief as possible, and often we let a chart speak for itself. While individuals might specialize in other areas of the market, we think that a continuous monitoring of the areas covered each day in the Update will provide a solid foundation and understanding of the broad market environment that will facilitate analysis in other areas.
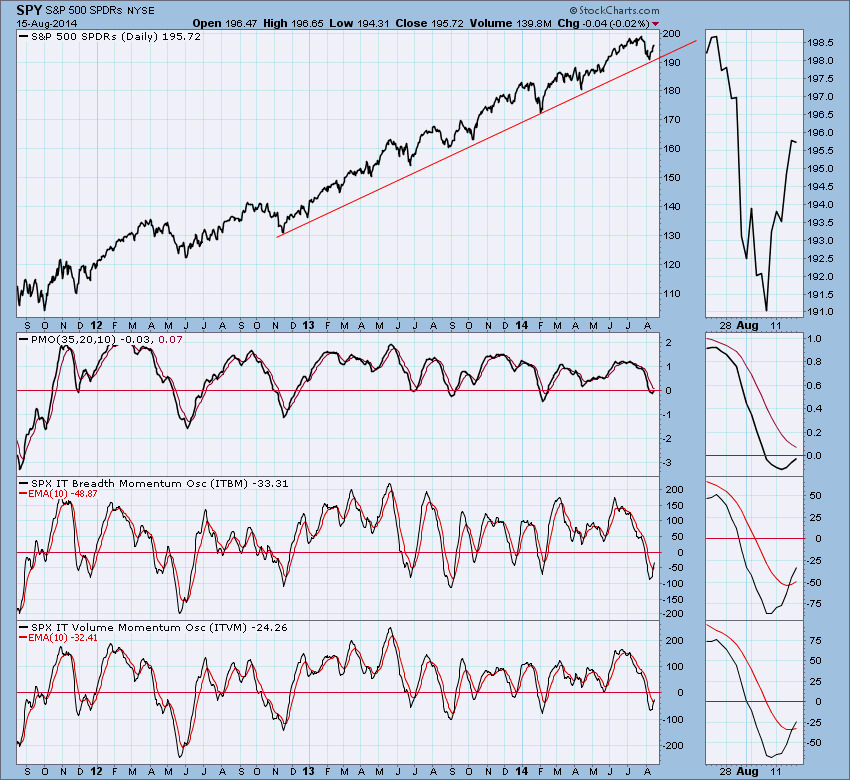
A prominent feature of the Update is coverage of internal indicator sets for three time frames, giving us a measure of market condition (overbought or oversold) in each time frame. For this article I will focus on the intermediate-term indicators for price breadth and volume: the PMO (Price Momentum Oscillator), the ITBM (Intermediate-Term Breadth Momentum) indicator, and the ITVM (Intermediate-Term Volume Momentum) indicator. We note that all three have bottomed in the area that has proven to be an oversold level over the last two years. The ITBM and ITVM have crossed up through their EMAs, and the other two appear to be headed in that direction. This action coincides with the price index having bottomed on a prominent rising bottoms line, so the picture in this time frame is positive, and a fair amount of price appreciation can occur before the indicators are once again overbought. There is no guarantee that price will actually move higher, but conditions certainly favor that outcome; however, a review of the short-term and ultra-short-term charts may temper that outlook somewhat.
Summary: Many people have expressed interest in a daily report that will maintain a continuing focus on the broad market, sectors, and the common areas of interest of gold, oil, the dollar and bonds. The DP Daily Update fills this need for StockCharts EXTRA and higher subscribers. To view a free sample, click here.
- Carl


