The SPDR Regional Bank Tracking ETF (KRE) is at a significant tradable decision point. So is the SPDR Bank ETF (KBE). While banks are not associated with the growth part of the market, they usually smell trouble before most of the other industry groups. On a chart, we consider the last bar of information the most important because its tradable. The rest is just history! Good history but it is the shoulda-woulda-coulda part of the chart. Digging in on the two SPDR Bank ETF's is timely this week because its a potential trade.
First the Regional Banking SPDR ETF (KRE) which is composed of 100% regional banks. Starting at the top, since the inception of QE in 2012 the SPURS line has been trending up. This recently changed with lower lows and highs. We can see that we are making new lows on that indicator. The RSI is still in bull mode by staying above 40. A breach of that level would be very concerning.
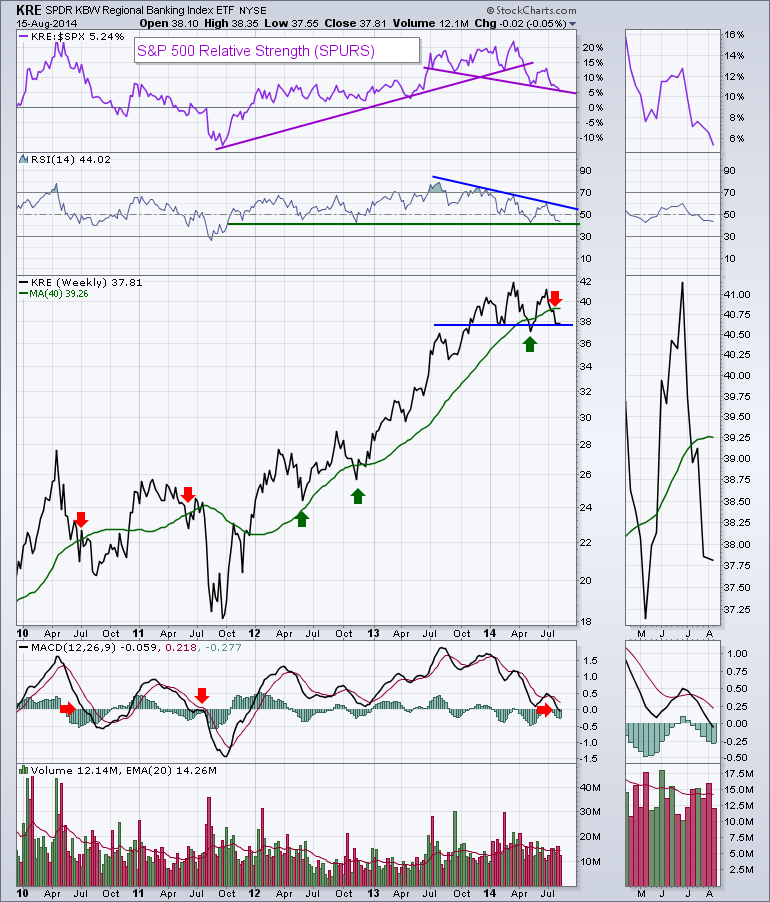
Moving onto the price chart, the 40 WMA has been support for over two years. We recently tested the 40 WMA in March, fell well below and bounced. We are now back below the 40 WMA indicated by the red arrows and have been for four weeks. We can see a significant topping structure building on the right hand side. Will it complete? I think the MACD might have the answer for us. While the breach of the 40 WMA had some whipsaws, when it was combined with a MACD below zero it was an important signal. All of the breaches were near the end of respective QE efforts by the Fed. As we can see on the zoom panel, the MACD black line moved into negative territory this week. That would appear to confirm the sell signal.
With a brief study on volume, we can see the average volume is declining. While the volume was below average this week, it is more concerning because it was also options expiration week. On the most recent high (the right shoulder of this topping pattern), in the zoom thumbnail you can see the last high had very low volume. The lack on interest then, the light volume on this OE week, multiple sell signals and a price sitting on a support line suggests a protective posture. That is for the regionals, lets look at the SPDR with the diversified Banks and other financial providers.
The Banking SPDR ETF (KBE) which is composed of 71% regional banks,29% other is shown below. The charts are very similar. The volume profile is different on the chart as this one pales in comparison in volume. The SPURS trend is making new lows, the RSI is still in bull mode and the topping pattern is almost identical. The volume on the zoom panel is very revealing. At the highs in June, it was also very weak. This weeks volume was slightly higher than the June volume but this was also options expiration. The low volume level for this week was last seen at the right shoulder high, and then its back to August 2012 other than Thanksgiving and Christmas weeks.
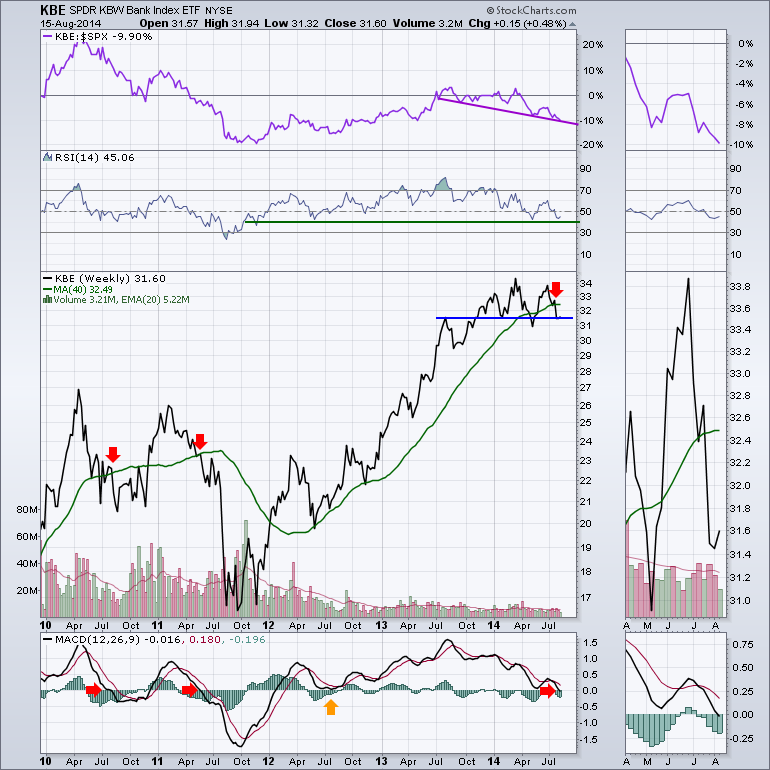
I think the most critical piece of information resides on the MACD in concert with the 40 WMA. Even the big diversified banks are not able to change the profile of this price and momentum action. Maybe this is the low point as the Hamptons empties out and Manhattan fills back up. But the trend seems the same on the regional banks as well so I don't think that will come into play here. The biggest change coming is the end of QE unless Janet Yellen's speech in Jackson Hole changes the trend on this chart.
How did this chart look at the 2007 top?
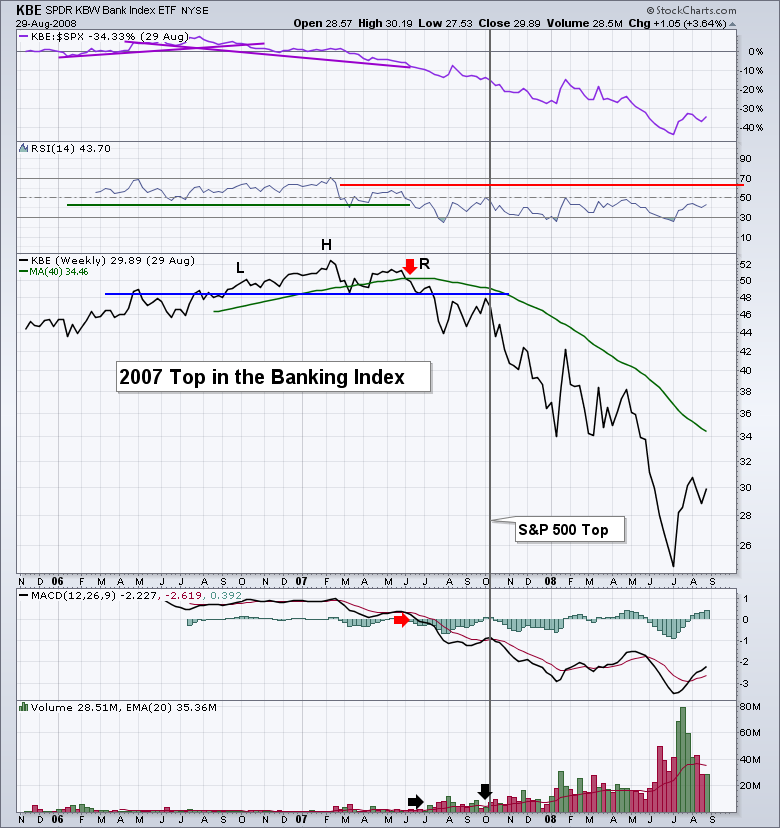
This ETF only started in late 2005. Things look 'photocopy' similar. While it looks like a 'riverside bank' at this point on Charts 1 and 2, there is nothing suggesting it can't be more cliffside either. The tops of 2010, 2011 and 2007 all have the same price action. So far I would suggest the MACD moving below zero with a price below the 40 WMA to be trouble. While the volume was increasing as the 'new' ETF in chart 3 became popular, it had an eerily quiet week after Options Expiration, September 2007. Three weeks later marked a market top. Close monitoring would appear to be in order. We'll figure out if its cliffside later!
Good trading,
Greg Schnell, CMT


