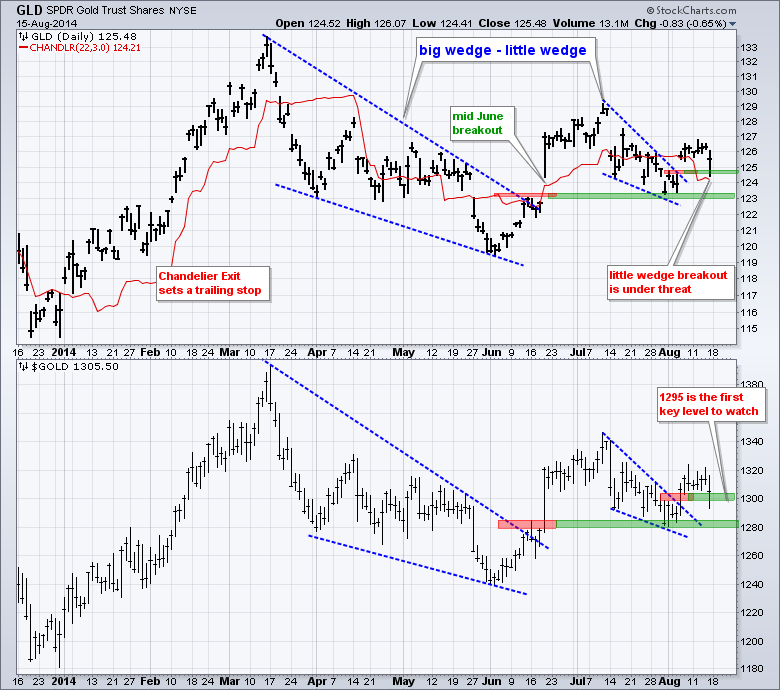
Gold broke out with a surge in early August, but stalled the last eight days and failed to follow through. Despite lack of follow through, the breakout is holding and has yet to be proven other wise. Let's see what it would take to prove this bullish signal wrong. The chart below shows the Gold SPDR (GLD) breaking out of the big wedge in mid June and holding this breakout with the bounce off 123 in early August. The ETF then broke out of the little wedge and the breakout line turns first support in the 124.5 area. At this point, I think a close below 124 would negate the little wedge breakout and increase the odds of a bigger break down at 123. The red line shows the Chandelier Exit, which acts as a trailing stop-loss. Using this indicator, traders going long on the mid June breakout and using this indicator to set a stop would have been stopped out in mid July. Traders going long on the early August breakout would still be in with a stop-loss just below 124.21, which is the Chandelier Exit value. You can read more about this indicator in our ChartSchool. And finally, ChartCon 2014 was outstanding and it was great to meet many of our members.

Good weekend and good trading!
Arthur Hill CMT
