Bullish Percent Indexes ( BPI's) are helpful in telling us the underlying sentiment of a group of stocks.
Here is the Bullish Percent Index for the Nasdaq Composite ($BPCOMPQ). The chart is a little busy, but follow along.
The gray area with the pink line is the Nasdaq Composite.It is very close to recent highs. The blue large squiggle line is the main title of the chart so the scale for that is shown on the right side of the chart.
As the market is moving higher, the percentage of stocks on a PnF buy signal ($BPCOMPQ) is waning. I have put two red lines and a shaded area between them on the chart. When the Percentage is above the top line we are in a strong bull. When we oscillate down to the lower area we are still in a strong area to expect support as in 2009 and February 2014. When it falls well below the red zone, it is a weak market. Usually dips into the 50% level are buys. However, when you are at new highs in the market and this level is the best you can get, you are probably near an intermediate term top, rather than a buying opportunity. We dropped almost 2% this week as the market was pushing higher every day. When I look to the left on this chart, if it can not get back above the lower red line, that is a time to be more cautious in the market. An example would be 2005, 2006, 2007. The real concern comes when each push up is less successful. The last time that sort of behaviour happened, the Fed stepped in like in 2012.
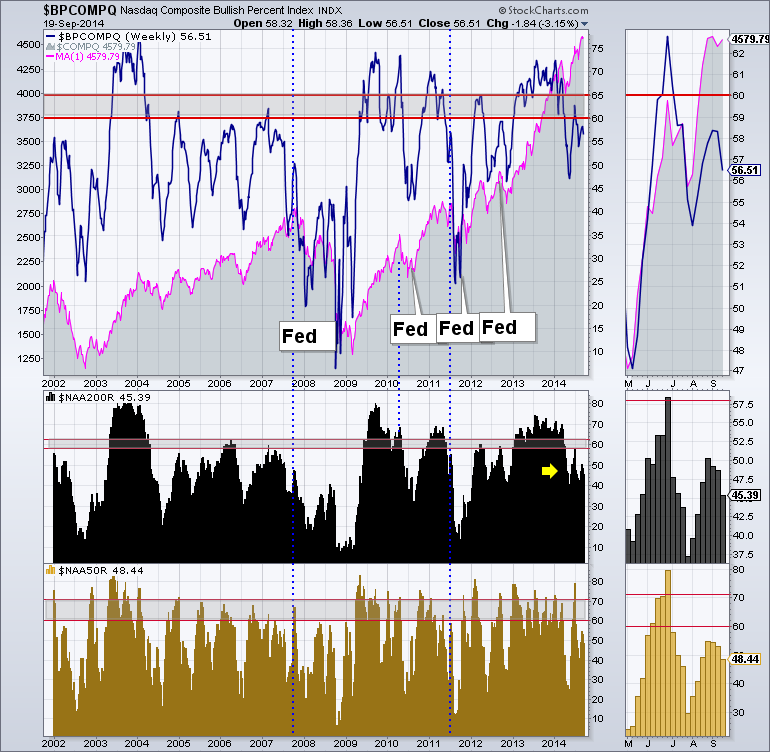
On the lower part of the chart is the percentage of stocks above the 200 Day Moving Average ($NAA200R). You can see we are near levels where the market topped before as shown in the blue dotted lines. Those levels show up after the market has been stronger, pulls back and then less stocks rise back above the 200 DMA. I would currently estimate we are similar to the 2007 top and below where the market rolled over in 2010 and 2011 as indicated by the dashed blue lines. The gold area at the bottom is the percentage of Nasdaq stocks above the 50 DMA. ($NAA50R). It is below 50 currently. So less than half the stocks are above the 50 DMA but we are making higher highs with fewer stocks. The market is getting weak. When this is the level as the markets still climbing into, it usually indicates a larger pullback is coming. So you are not buying the dips at this level (because the market is near the highs not the lows) as you are seeing that these are the levels when the market tops historically.
Here is the same chart for the New York Stock Exchange. We can see the $BPNYA is having trouble getting back above the 65 level. At this point it is important to note. The diminishing peaks going back into 2013 makes this more concerning. I would suggest that if it continues to struggle here, the market will roll over. So even though we had a higher intraday all time high for the Dow and the $SPX, the broader market of stocks on the NYSE are significantly weaker.
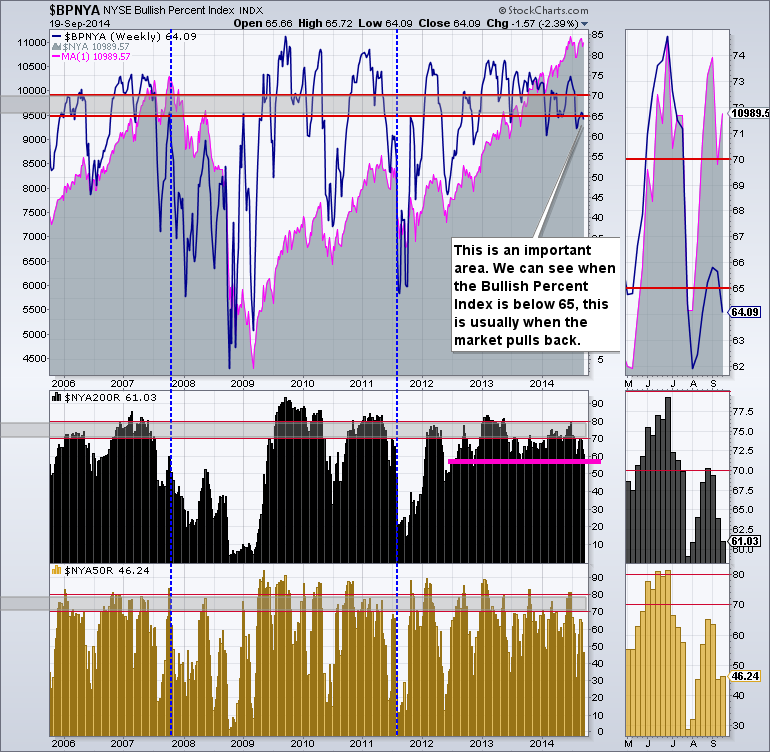
We can see the bold pink line on the New York Composite Percentage Of Stocks Above The 200 DMA ($NYA200R). The recent push up against 70% was important. This was a level where the markets failed from in 2011. In 2007, it was closer to 60%.
The percentage of stocks above the 50 DMA ($NYA50R) is only 46% even though the market pushed higher almost every day.
All this adds up to caution and an expectation for a larger pullback. Here are the links to the charts for the $BPSPX and $BPNDX . They are more bullish. These large cap stocks are holding the indexes up. If they start to breakdown, the market will be rolling over.
Good trading,
Greg Schnell, CMT


