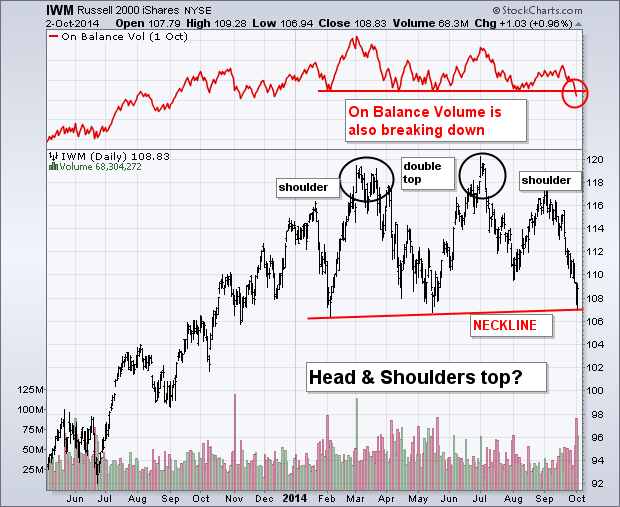
A debate is going on within the technical community as to whether or not the Russell 2000 Small Cap Index is in danger of completing a "head and shoulders top". A case can certainly made for it, although it would be an unusual one. The daily bars in Chart 1 show Russell 2000 iShares forming two smaller peaks (shoulders) during January and late August. In between those two lower "shoulders" a "double top" was formed between March and early July. While it might not qualify as a textbook "H&S" top, the bearish warning is still valid. At the moment, the Russell 2000 iShares (IWM) are testing a "neckline" drawn under its February/May lows (red line). A downside violation would complete the topping pattern that's been forming for months. The negative volume pattern confirms that bearish warning. The volume bars along the bottom of the chart show heavier trading during selloffs and lighter volume on rallies. This week's downside volume has been particularly heavy. The red line on top of Chart 1 is On Balance Volume (OBV) which is a running cumulative total of upside versus downside volume. It's also in danger of breaking its own support line. [A 1% bounce today kept the IWM above neckline support].