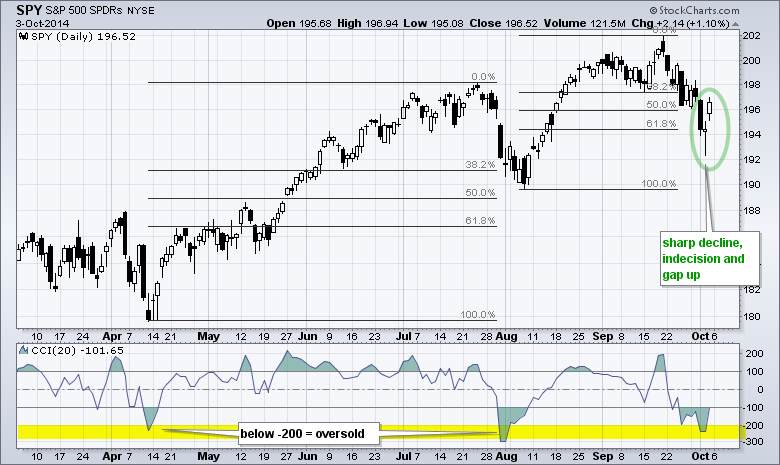
The S&P 500 SPDR (SPY) appears to be putting in another higher low that could signal the resumption of the long-term uptrend. First and foremost the long-term trend is up because SPY recorded a 52-week high less than three weeks ago. In addition, the charts shows a clear progression of rising peaks and rising troughs. Under this assumption, declines are viewed as corrections within the long-term uptrend. A reversal of this decline would end the correction and argue for a move to new highs.
The chart below shows the ETF becoming oversold as CCI moved below -200 for the third time in seven months. Oversold is a condition and this tells us to be on alert for a reversal. In addition, the ETF was near the 61.8% retracement, which is a Fibonacci number that can sometimes mark reversal areas. Thus, the combination of oversold and the Fibonacci retracement were enough to put traders on alert for a reversal.
The first signs of a reversal are now apparent with the candlesticks over the last three days. The first is a long filled candlestick that shows strong selling pressure. The second is an indecisive candlestick with a spike low near 192. This candlestick also reflects an intraday reversal as SPY dipped to 192.35 during the day and rallied to close at 194.38. The third candlestick completes the reversal with a gap and close above 196. This candlestick sequence is similar to a morning doji star. At this point, it is important that the gap holds. After all, a strong and valid reversal should not look back. A move below 194, therefore, would show weakness and warrant a reassessment.
Good trading and good weekend!
Arthur Hill CMT

