The nearly six year bull market lives on, but the bulls have been taking several body blows of late. Whether this bull market continues could depend on a couple of key industry groups within the technology space.
First, let's take a look at computer hardware ($DJUSCR). This is the place that Apple (AAPL) calls home. This index topped in late November and has been mired in a bullish wedge the past couple months. On Friday, the DJUSCR hit price support at a time when its 60 minute MACD is just beginning to turn higher. Take a look at the daily chart of this influential group:
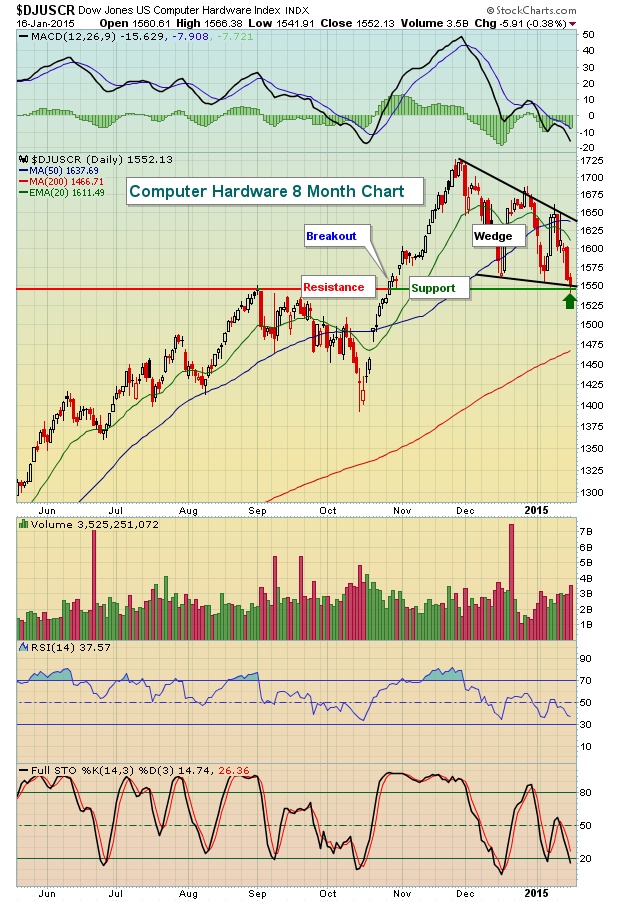
From this chart, you can see that Friday's action left the DJUSCR testing key price support at 1545 while in the midst of a bullish wedge formation. It's also easy to see that over the past several months, RSI readings in the 35-40 area have constituted excellent reward to risk entry points. It's difficult to say whether this level will hold as support, but it certainly offers up a low risk entry opportunity.
Now check out the shorter-term 60 minute chart:
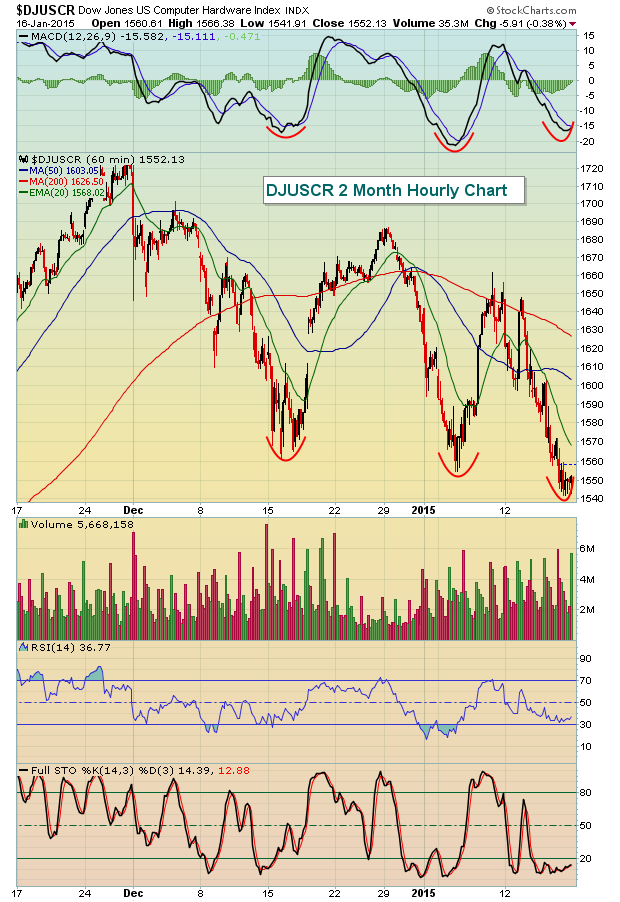
It appears as though this index is beginning to carve out a bottom very similar to the bottoms that formed in early January and mid December. A reversal at this level would not only make sense on the 60 minute chart, but also on the daily chart where that bull wedge has carried price action down very close to key price support.
In addition to computer hardware, semiconductors are holding onto significant price support as well. Check out the recent downward momentum and the test of price support on Friday:
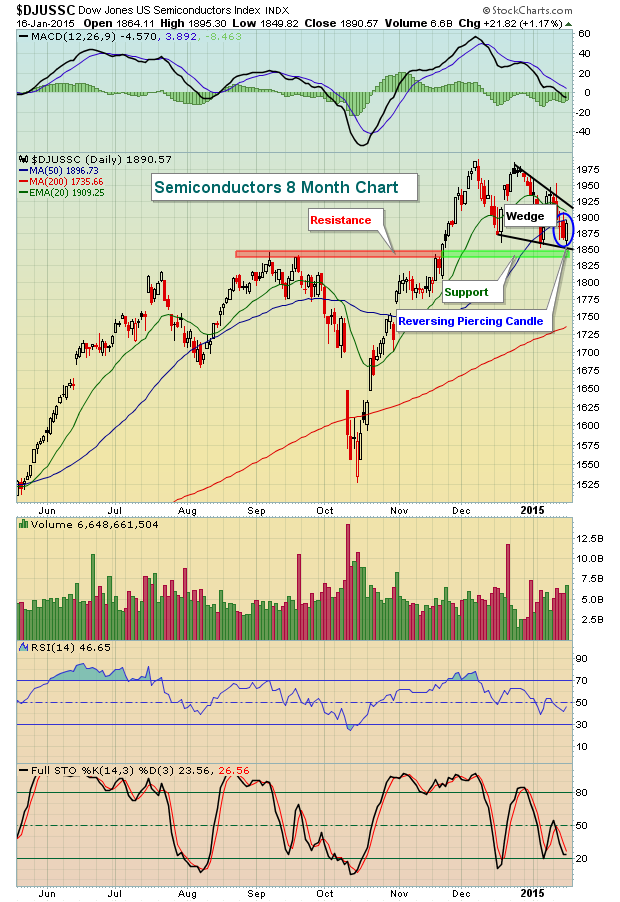
Semiconductors also are in a bullish wedge pattern and on Friday printed a bullish reversing piercing candle at price support and the bottom downtrend line of its wedge pattern. Throw in the RSI reading in the 40s and it appears that semiconductors also sport a very solid reward to risk ratio for traders on the long side.
Technology has been one of the driving forces behind this bull market so watching to see if these two leading industry groups can maintain their uptrends and stave off the bears will likely go a long way in determining how much is left in this bull market.
I'm featuring a key technology company testing major price support as my Chart of the Day for Tuesday, January 20th. You can register for this chart and all future Charts of the Day by CLICKING HERE.
Happy trading!
Tom Bowley
Chief Market Strategist
Invested Central


