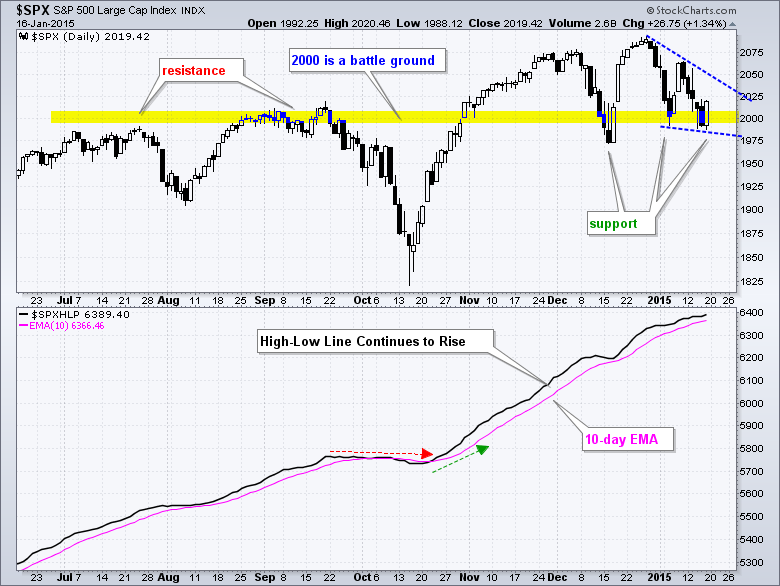
Even though big round numbers should not have any technical significance, it is hard to argue with the magnetic pull of 2000 on the S&P 500. The index first neared 2000 when it broke above 1975 in July. After a pullback to the 1900 area in early August, the index made another run at 2000 and even crossed this level a few times in September. Alas, the index fell back again in October with a deep plunge below 1850, but came roaring back in November and finally got through 2000. Just as it seemed the 2000 area was going to be relegated to the past, the index fell back below 2000 in mid December. Notice how this broken resistance zone turned into support and the index again bounced back to new highs in late December.
So here we are in mid January and the index is once again battling the 2000 level. With Friday's weak open and strong close, the 2000 area is once again acting as support. Notice that the index formed a hammer on Wednesday and a bullish engulfing on Friday. Now let's see if we can get some follow through. A move above the wedge trend line would validate the 2000 area as support once again and suggest that the January correction is ending.
The indicator window shows the S&P 500 High-Low Line, which is a cumulative measure of High-Low Percent ((new highs less new lows) divided by total issues). The line rises when new highs exceed new lows and falls when there are more new lows. This simple indicator gives us an idea of the overall trend. The bulls get the benefit of the doubt as long as new highs exceed new lows, and the line rises. After flattening in late September and turning down in early October, this breadth indicator turned back up in late October and moved above its 10-day EMA. It has been above its 10-day EMA for almost three months now. The S&P 500 has a bullish bias as long as this line is rising (above the 10-day EMA).
Thanks for tuning in and have a great three day weekend!
Arthur Hill CMT


