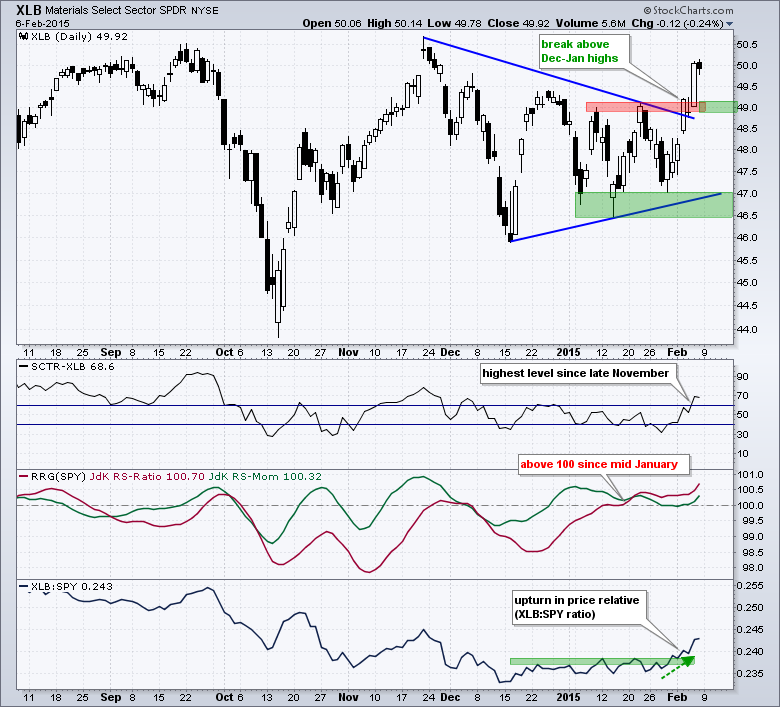
The Materials SPDR (XLB) sprang to life on the price chart and three relative strength indicators broke out. On the price chart, XLB surged in October-November and then consolidated in December-January with a big triangle. Trading was certainly choppy within the triangle, but the ETF finally made a decisive break above the December-January highs. This breakouts signals a continuation of the Oct-Nov advance and projects a move to new highs. Chartists can mark first support near broken resistance (49) and long-term support in the 46.5-47 area. Within the group, note that Air Products (APD), DuPont (DD), Mosaic (MOS), Sherwin William (SHW) and Vulcan Materials (VMC) are leading with new highs this week.
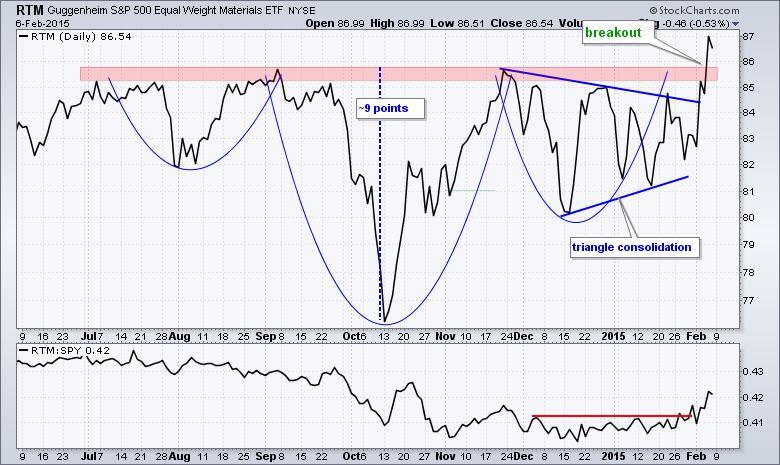
The indicator windows show the StockCharts Technical Rank (SCTR), the Relative Rotation Graph indicators and the price relative. All three measure relative performance against the S&P 500 SPDR and all three show relative strength in XLB. The SCTR moved above 60 and to its highest level since late November. The RS-Ratio line (red) moved above 100 in mid January and is at its highest level in over six months. The price relative (XLB:SPY ratio) broke above its January highs with an upturn the last two weeks. The second chart shows the Equal-weight Materials ETF (RTM) breaking above neckline resistance from a large inverse head-and-shoulders pattern. Based on traditional technical analysis, the height of the pattern is added to the breakout area and a move to the mid 90s is projected.
Thanks for reading and have a great weekend!
Arthur Hill CMT


