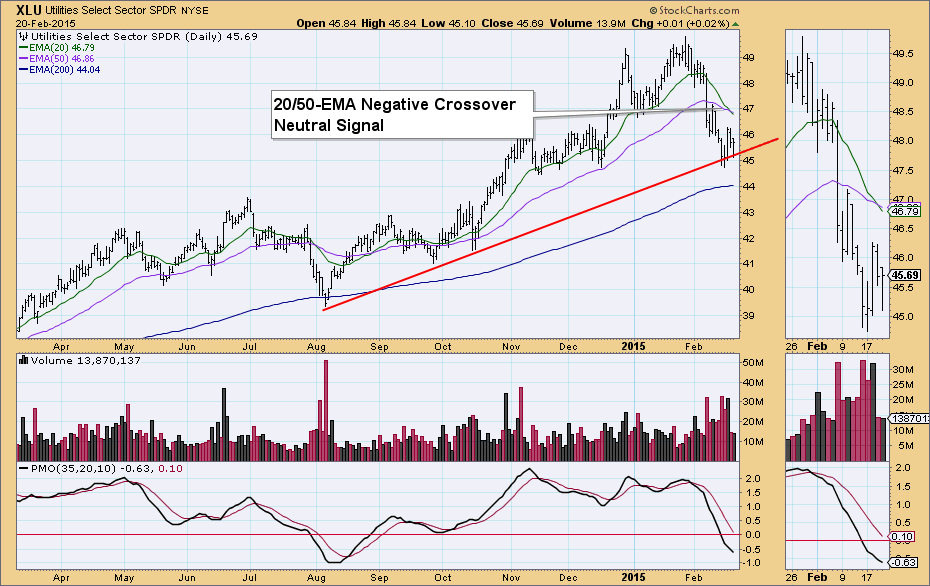
On Friday's DecisionPoint Alert Report, the Utilities SPDR (XLU) went on a Neutral signal. It's sister, the equal-weight Rydex version (RYU) remains on a BUY signal. It appears that it will flip next week to a Neutral signal as well.
We see that Intermediate-Term Trend Model generated the Neutral signal on XLU when the 20-EMA crossed below the 50-EMA. It didn't generate a SELL signal because the 50-EMA is above the 200-EMA. When the 50-EMA is above the 200-EMA we consider XLU to be in a "bull market". Price has been flirting with rising bottoms support drawn from the August 2014 low but hasn't broken down. However, on the bright side (yes there is a bit of bright side here), the Price Momentum Oscillator (PMO) is nearing what appears to be oversold territory and possibly slowing its descent.
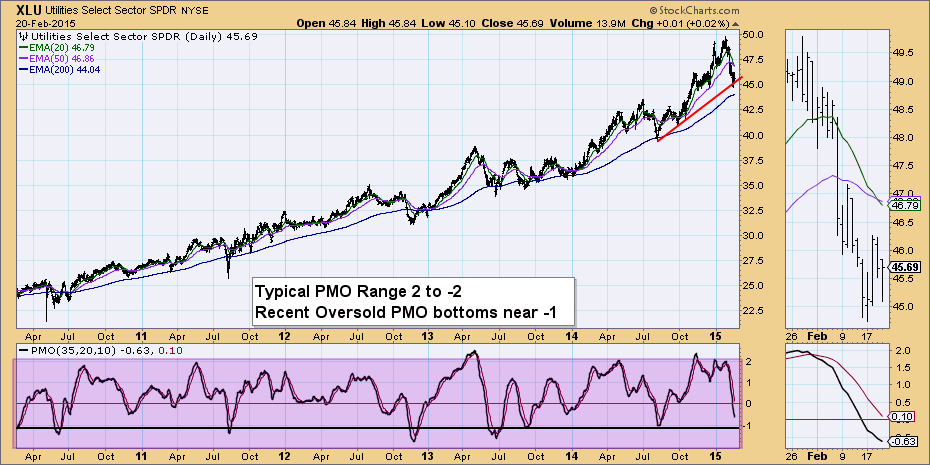
One way to determine if the PMO is reaching ordinary overbought or oversold territory, you can move the dates out on the daily chart and see where it tends to oscillate. I've increased this daily chart to a five-year versus a single year. In XLU's case the PMO range is 2 to -2. So technically a -.63 is not that oversold. Yet, when we look at where the most recent bottoms are it is more like a -1. So indeed, the PMO is oversold on XLU and could be ripening for a bottom signifying a switch in momentum. Of course it also means that it could accommodate much more downside before hitting extremely oversold territory.
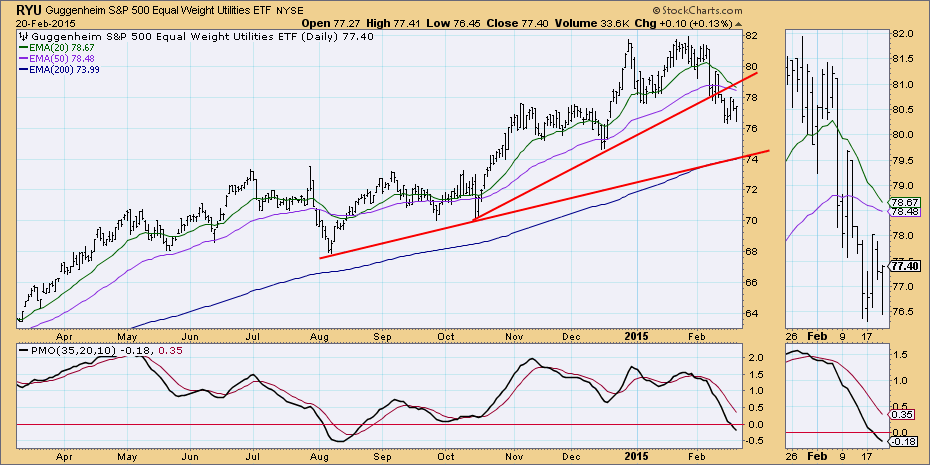
Let's take a look at the equal-weight Utilities ETF (RYU). The chart is very similar, as we would expect. It will generate a Neutral signal soon when the 20-EMA crosses below the 50-EMA. I also note that price has not hit rising bottoms support like XLU and it has quite a distance to cover before it does. I believe that doesn't bode well for XLU.
The Utilities sector is the first to flip back from BUY signals on the DP Alert Daily Report. If we start seeing more turnover on that table it is a warning flag regarding the weakness of the market as a whole.
Don't forget to sign up to attend my next DecisionPoint LIVE! webinar next Wednesday, February 25th. Here is a link to the sign up page. Be sure to tweet your chart requests @_DecisionPoint for guaranteed review or bring them and it might be chosen for review at the end of the program.
Happy Charting!
Erin


