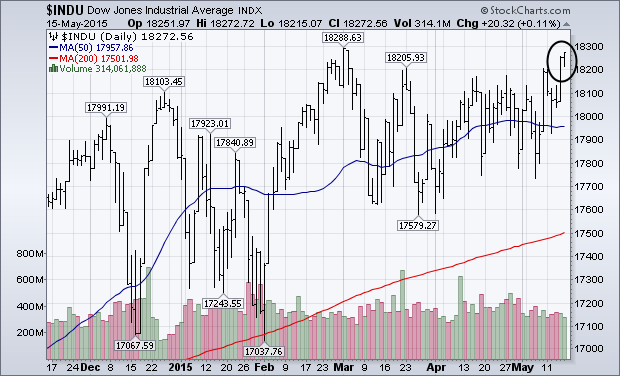
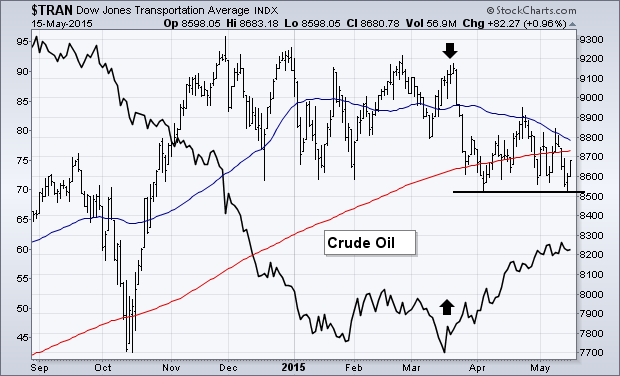
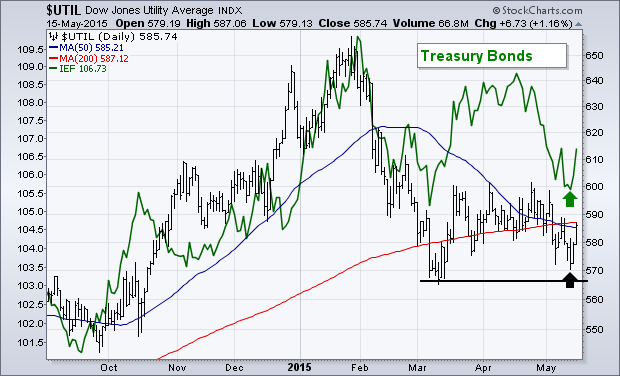
I've been writing about the continuing discrepancy between three Dow Averages. But things may be starting to improve. Chart 1 shows the Dow Industrials closing at a three-month high and just shy of its early March peak. [The S&P 500 ended at a record close]. All of this is good. Volume, however, didn't pick up much which shows a certain lack of enthusiasm. I've been suggesting that the industrials are being held back by much weaker action in transportation and utility stocks. Chart 2 shows the Dow Transports trading below its 200-day moving average and near the bottom of its 2015 trading range. Rising crude oil (black line) is a big reason why fuel-sensitive transports have been so weak. [A weaker dollar has also been part of the problem since it's supporting the price of oil]. Chart 2 shows the TRAN bouncing off its early April low. But it has to climb back above its moving average lines to improve its chart picture. It's hard to imagine the industrials climbing strongly without some help from the transports. Chart 3 shows an even weaker picture for the Dow Utilities which is also below its 200-day moving average. Weak utility performance is tied to a weak bond market (green line). The correlation between the two is pretty apparent. The good news there is that the UTIL is bouncing off its March low with some help from bonds (more on that shortly). A move above its April high is necessary, however, to signal a bottom. That would also help the rest of the market, and rate sensitive stocks in particular.