Last week was not only an interesting for price, ultra-short-term indicators finally woke up. With indicators staying mostly mum this week, it was exciting to see movement in the shorter-term.
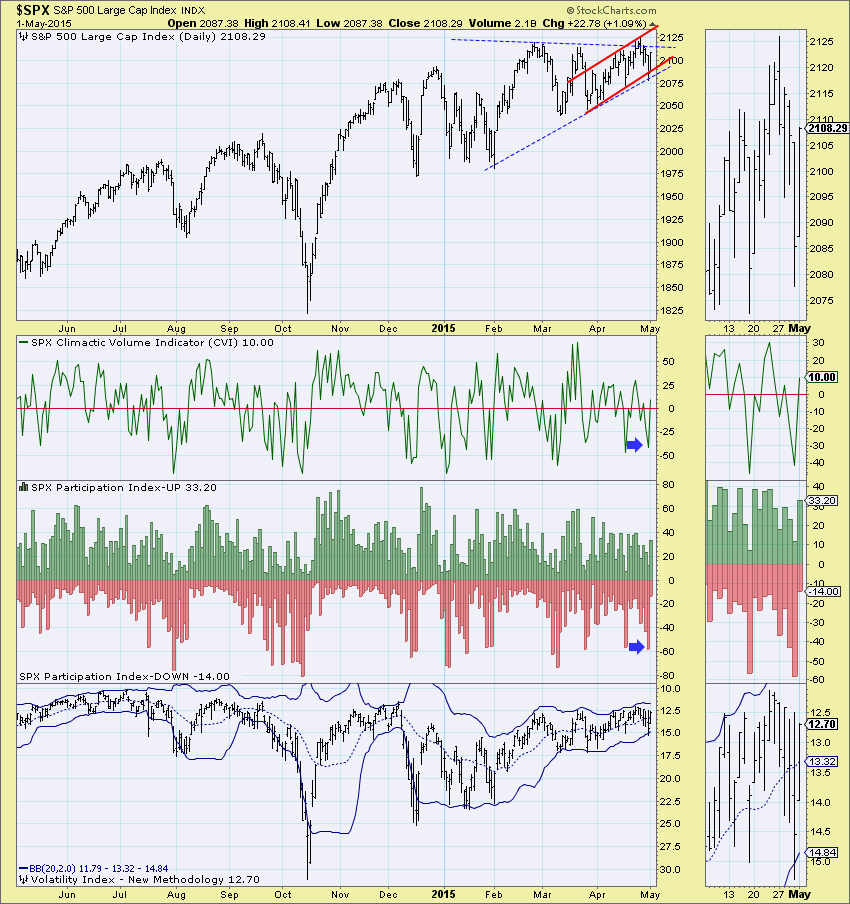
Below is a chart of our ultra-short-term indicators taken from the DP Chart Gallery (available free here). When observing our ultra-short-term indicator chart, we look for climactic movement, that is, spikes in one direction or the other. In the case of the chart below, on Thursday we saw spikes on the Climactic Volume Indicator (CVI) and Participation Index - DOWN. You will also notice in the thumbnail that the VIX moved just outside its band. This was an exhaustion climax as it signaled selling fatigue.
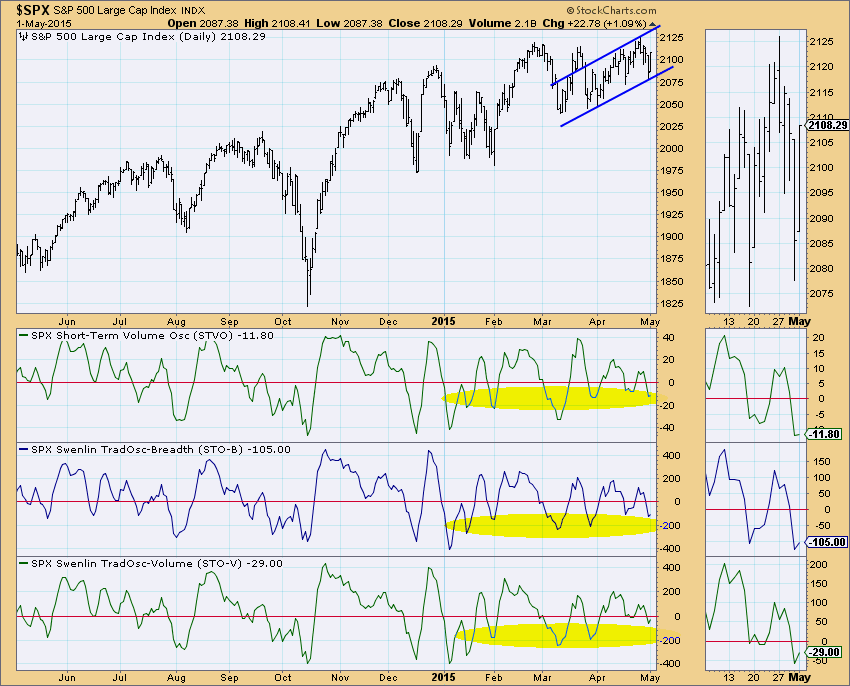
I'd also like to point out the short-term price pattern of a rising trend channel. I've been watching the development of a bullish ascending triangle, but price is now getting too close to the apex which dulls the pattern's outcome. I say this because at the apex, it wouldn't require significant price action for it to breakout of the pattern. It could even end up drifting through. Upon further inspection, I decided that a rising trend channel was a better descriptor of what the market is doing in the shorter-term.
Our short-term indicators all bottomed in recently "oversold" territory. True oversold territory would be at the lows around -40. In the context of a short-term rising price trend, it's bullish.
Based on these shorter-term indicators and the identifiable rising trend channel, a test of the top of the channel is likely on the agenda.
Happy Charting!
Erin


