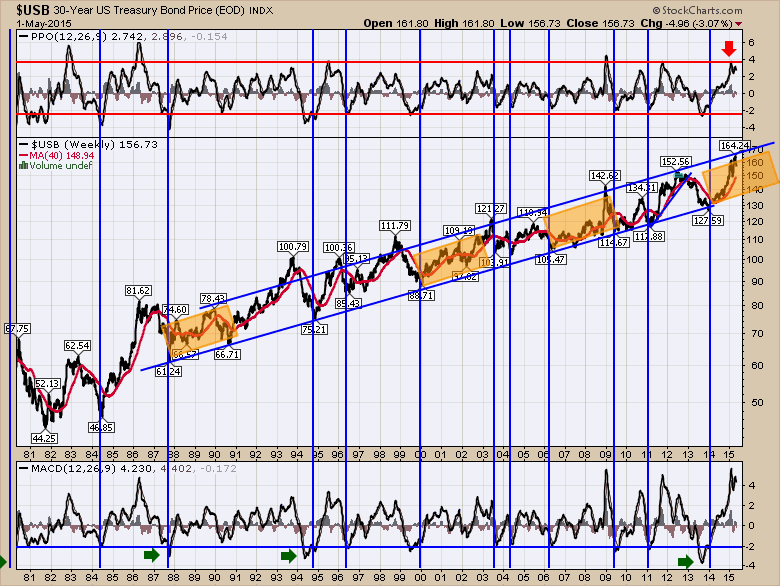
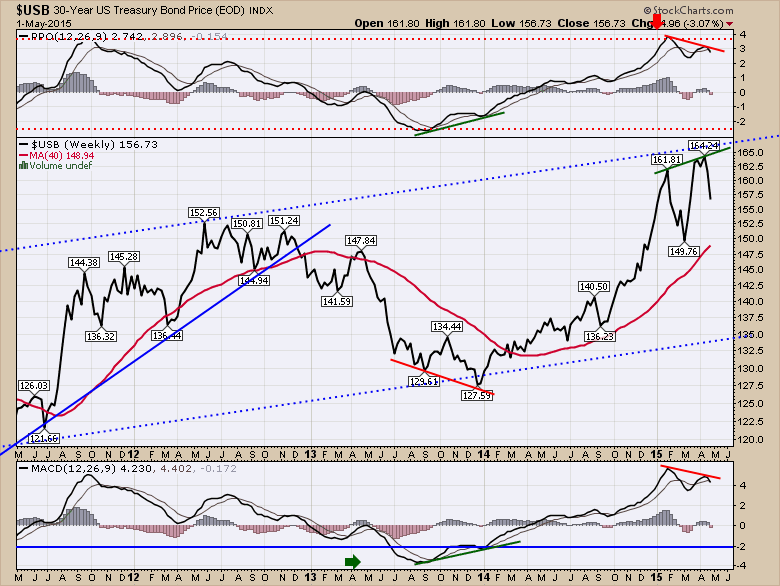
The long bond price looks to be at a level of major reversal. Diving into the chart, we can see that the PPO is at another one of the extreme levels in the entire 30 year bond run. The extreme reading on the MACD is not as clear a signal because the MACD will form higher waves as the price moves higher. The PPO is a percentage oscillator. It shows us when there is an extreme percentage price move. So a 4% move on the PPO is significant throughout the time frame of the chart. The bond price bottomed out in 2014 after a nice divergence showed up on both the PPO and the MACD. Chart 2 shows a zoomed in version.
Notice the positive divergence on the $USB price in January 2014 on Chart 2. Now in April 2015, we have a typical negative divergence.
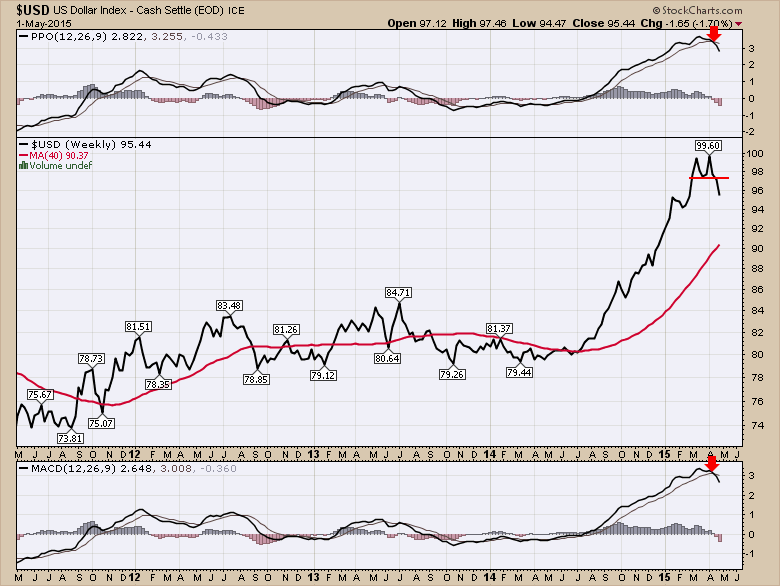
For a foreign investor, this reversal in bonds is a problem. However, this also coincides with the reversal in the $USD. If the $USD rolling over is added in, the bonds will lose value much faster to create losses very quickly.
The main problem here is that no one expects the bonds to sell off, whereas a year ago, no one expected the bonds to be the upcoming trade of the year.
I expect the bonds to retrace quickly as foreign bondholders abandon their positions. We'll see if that happens. Investors would buy TBT to try to profit in this trade. Foreign investors will have trouble making money in a TBT trade if the $USD is falling. This is a trade for US investors. Because of all the global turmoil, this could reverse but it looks to me that the signals are clear at this point in time. As always, an exit strategy is as important as an entry strategy.
Good trading,
Greg Schnell, CMT


