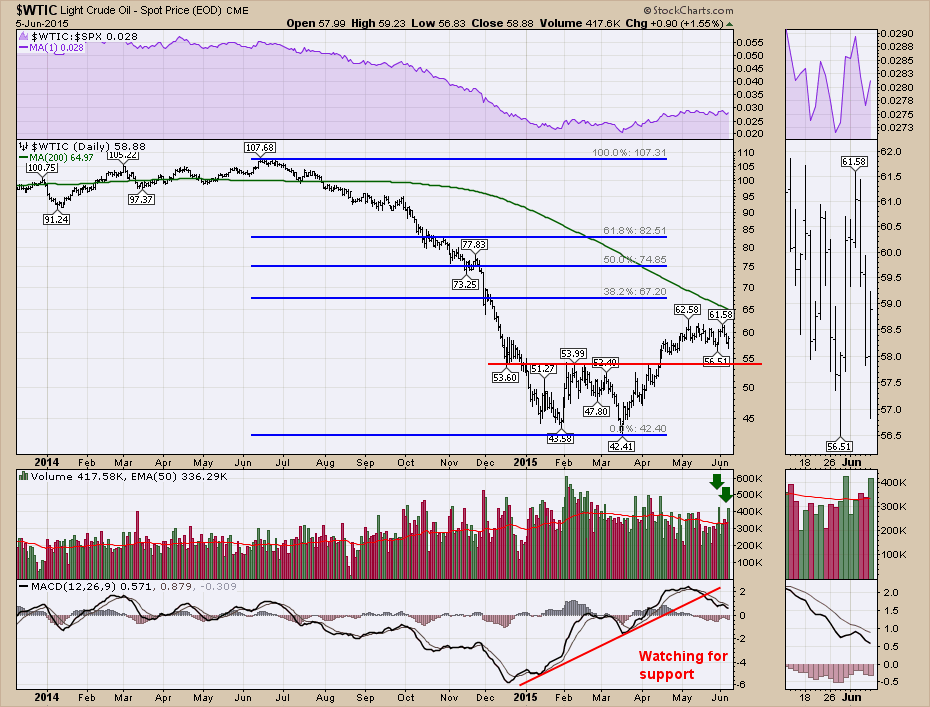
Crude Oil is the engine of nations. On June 13th, 2014 crude oil peaked and started a precipitous decline. From an intraday high of $107.68 to a low of $42.41 it has been a painful ride for energy companies and the oil and gas service sector. This chart sports numerous technical patterns.
- A double bottom $43.58 and $42.41. There was positive divergence with the MACD making a significantly higher low up near zero on the second low.
- Price action continues to be under the 200 DMA a year later. We are testing that area now, which gets closer every day as the 200 DMA comes down.
- After breaking through resistance at $54, we have consolidated sideways. Price action has been between $56 and $62 which is a range of 10%.
- We have failed to make it back to a Fibonacci retracement level of 38.2% in a year. That level sits at $67.
Let's look at the major energy companies to see what their charts are telling us. To no surprise the major uptrend has been broken on all of the charts. But more importantly, all of these companies shown below continue to have lower lows which continues the trend lower. This group of companies were able to exceed the 2008 highs.
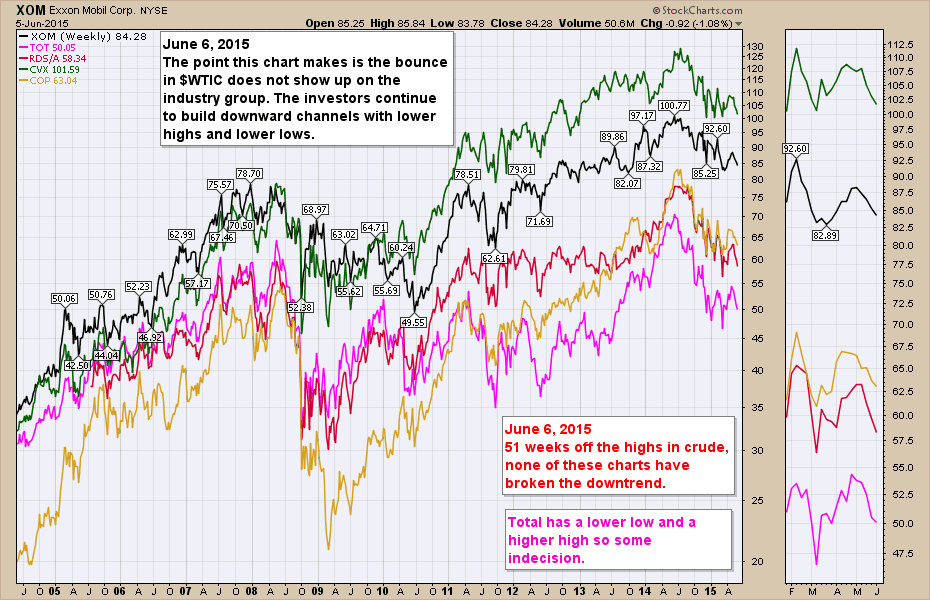
As most companies will start budget planning in August for 2016, the reality is that they will do another round of layoffs, losing more talent and further delaying projects without an improvement on return of capital. This slows overall capital spending which has fallen significantly for the entire stock market, mostly due to the oil companies slowing spending across the input sectors.
Looking at the next group of oil majors, it doesn't look so good. The group below were unable to take out the 2008 highs. They continue to wobble sideways to down. Recently a few of them have started to bounce, like a double off the lows for PBR.
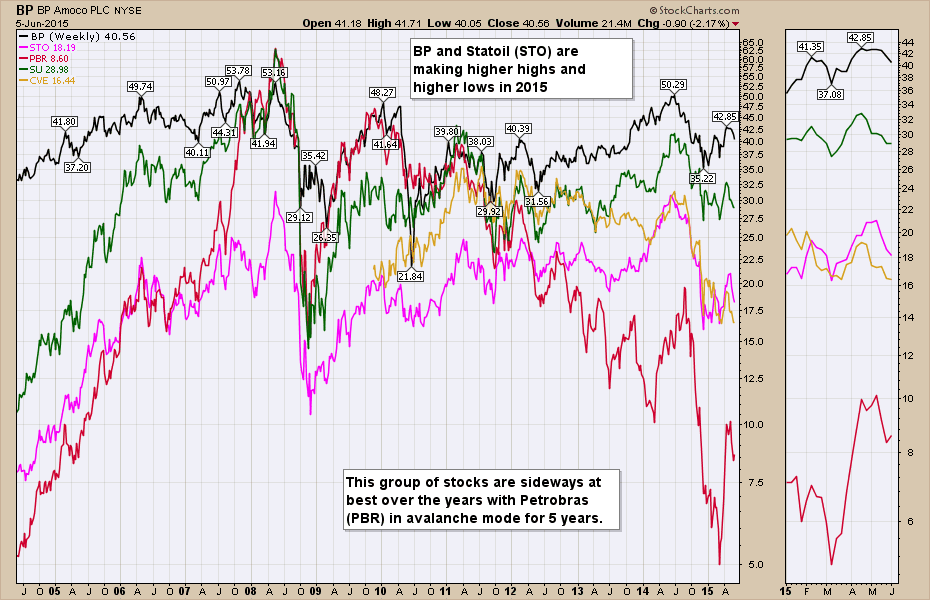
The industry and the industry majors still look muted and do not show any meaningful change in trend. Rallies are being traded not held. Since November, the US equities market has gone sideways with no meaningful progress higher. The energy sector has gone from providing energy to being a millstone on the overall market. Obviously the $USD will impact the price of oil, but investors have not started to reverse the trend in these energy stocks. The industry majors could all take another leg lower if the crude oil market does not meaningfully improve before 2016 budgets. I will post an article on The Canadian Technician blog on Sunday with the individual charts for each company. Readers can subscribe for email alerts or RSS feeds to most blogs on the top right corner of each blog page. I would encourage readers who are interested to view the webinar of 20150604 as some meaningful chart damage was done with deflationary pressures showing up on the charts. Click here for the recording.
Good trading,
Greg Schnell, CMT


