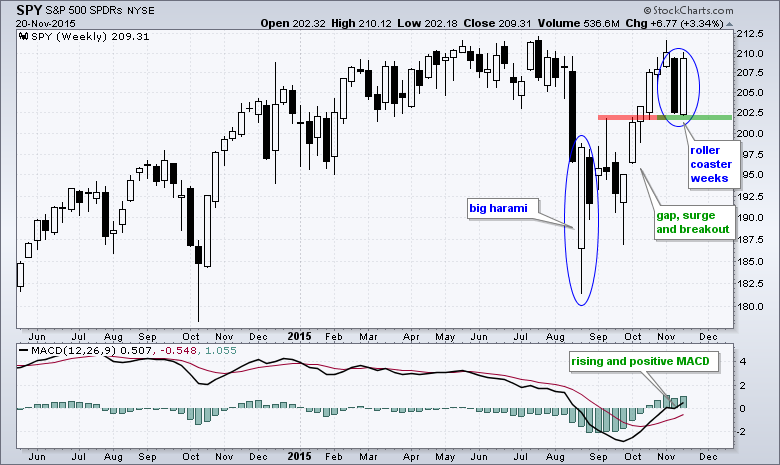
The S&P 500 SPDR (SPY) acted just like a roller coaster the last two weeks. It took traders for a wild ride and then dropped them off right where they started - a little frazzled no doubt. SPY opened near 209 on Monday, November 9th, and then plunged to close near 202.5 the following Friday. The ETF formed a long filled candlestick (black) that reflected a week of strong selling pressure. SPY started the following week with an open just below the prior close, but quickly found its footing and surged back toward the open of November 9th. We now have a long hollow candlestick (white) showing a week of consistent buying pressure. Notice that the open of the prior black candle is equal to the close of the current white candle.
The two week ride was certainly a wild one, but it was not enough to affect the trend on this weekly chart or negate the October breakout. SPY broke out with a gap-surge in early October and a breakout in mid October. Momentum also came alive as MACD moved above its signal line. Thus, the breakout and momentum upturn were already in place at the end of October. The early November selling pressure was intense, but did not derail the October breakout. Notice that broken resistance turned support (red to green) and held with this week's surge. Going forward, broken resistance and the November low mark the first area to watch.
****************************************
Thanks for tuning in and have a good weekend!
--Arthur Hill CMT
Plan your Trade and Trade your Plan
*****************************************

