I'm not ready to write off this bull market as the most important indication of all - the combination of price/volume - remains bullish in my view. But the signals "under the surface" are beginning to erode. One of two things will likely happen. Either we'll see those under the surface resume their prior strength to sustain the current ongoing bull market OR we'll see price breakdowns in our major indices to confirm the warning signs that are beginning to emerge. Before I discuss this further, it might be helpful for you to review the many signals that I like to watch in terms of identifying potential market tops and bear markets. I wrote a 7 part series on this subject earlier this year and it might be timely to review those articles. You can CLICK HERE for the first article in the series entitled "How Do Stock Market Tops Form". At the bottom of the article, click on "Next Article" to work your way through the entire series. In addition, at the bottom of every blog article at StockCharts.com, you can "Subscribe" to that author's blog and receive new articles in your e-mail as soon as they're published. It's a great feature and all of us as StockCharts.com appreciate your support. To subscribe, there's a question "Would you like to receive e-mail notifications whenever a new article is added to this blog"? Click the "Yes" button, enter your e-mail address and then click on the "Subscribe" button. It's as simple as that!
To review the current technical picture on the S&P 500, let's look at a long-term chart:
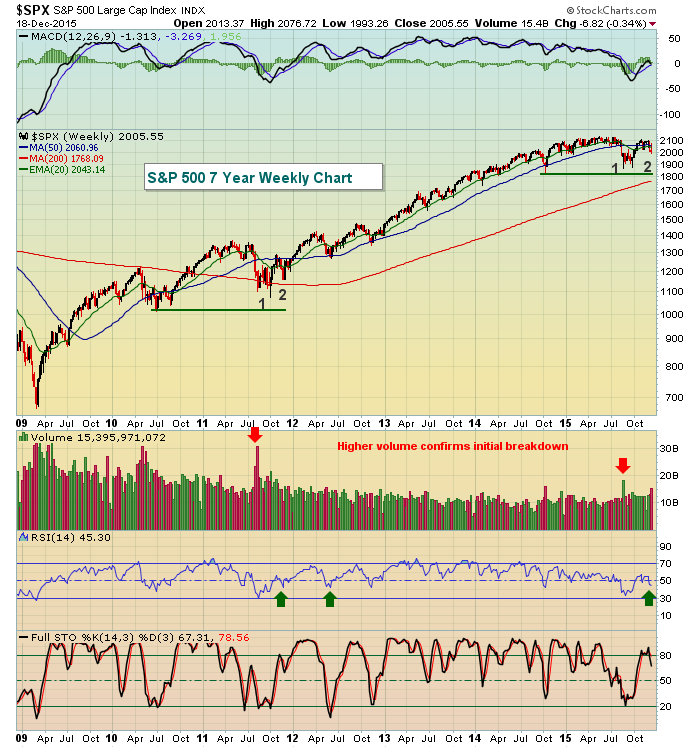
The big question that remains: Is this a correction or the start of a bear market? A bull market is a series of higher highs and higher lows. As we saw during the correction of 2011, the price of the S&P 500 broke beneath key moving averages, volume was heavy and the weekly MACD fell beneath centerline support - all necessary components of the beginning of a bear market. But on the subsequent rally in the latter part of 2012, bull market rules began to apply once again. Weekly RSI held support at 40 (green arrows). Price lows were not violated. And ultimately, the bull market resumed. Now let's fast forward to the current technical state. Thus far, the price/volume picture and the series of higher highs and higher lows remain bullish and intact. Of course, we don't know the "rest of the story" just yet as it's unwritten. We are sideways consolidating off an uptrend and that pattern is typically bullish with higher odds of a breakout rather than a breakdown. Bottom line, I'm bullish looking at this chart. HOWEVER, one of my "under the surface" signals that I mention in my Market Top series is looking more and more bearish. Check out the recent rotation away from transportation stocks ($TRAN) to utility stocks ($UTIL):
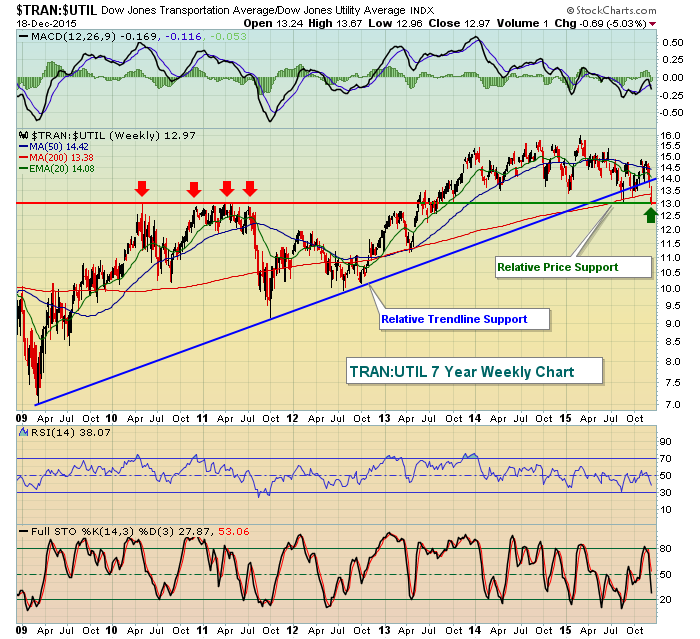
This is just one signal, but money is clearly rotating away from transportation stocks and into utilities. After breaking relative trendline support, now this ratio is at relative price support near 13. Further deterioration in this ratio would be bearish with a heavy volume price breakdown confirming the notion of a potential bear market. Please be cautious.
Merry Christmas, happy holidays and happy trading!
Tom


