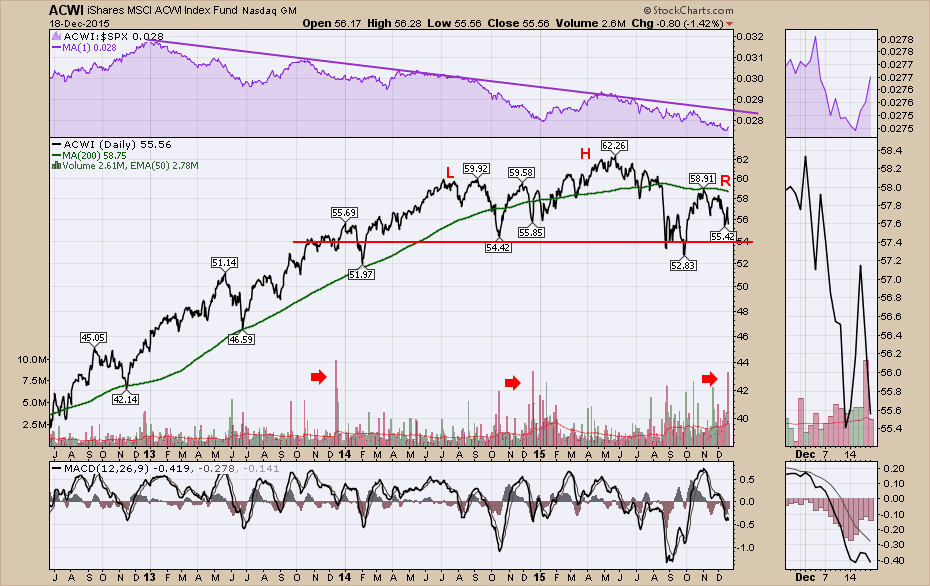
The markets have been rolling over worldwide in 2015. The big picture worldwide is a massive topping structure as shown by the MSCI All World Index (ACWI). This index has a 53% weighting towards the USA and 9 of the top 10 are American companies. I have shown the chart with daily data so you can see the last 3 years have had a huge volume day. in December. Looking into the zoom panel, you can see the high volume day was Thursday, not Friday which normally has high volume due to quarterly Options Expiration. I am surprised by this volume on Thursday, but we'll have to see if that is a signal of major selling going forward. Notice how the 200 DMA in green has been supportive all the way up and is now resistance that we can't seem to get above.
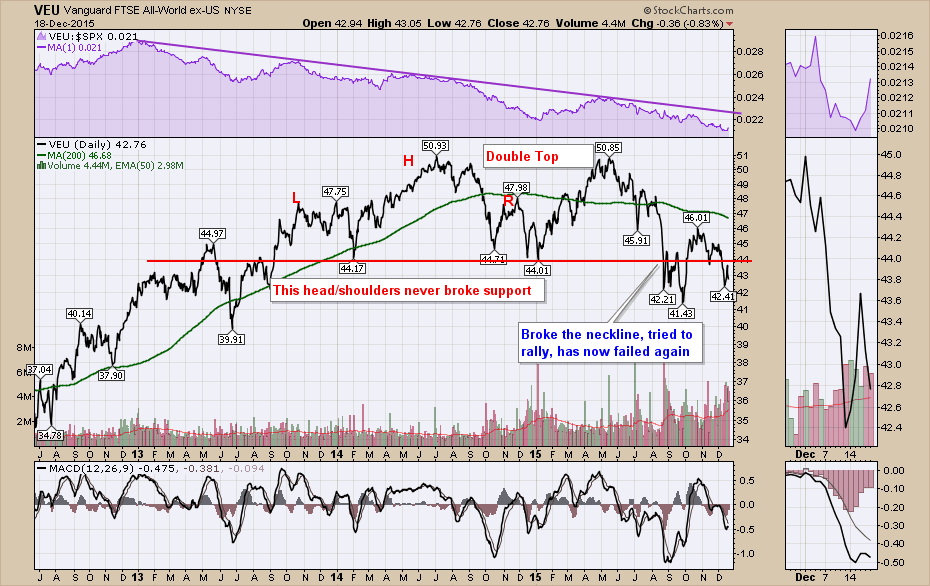
If we exclude the US market, we can use the Vanguard FTSE All-World ex-US ETF (VEU). This chart is very different in character. By the end of 2014 it had completed a topping structure. Early in 2015, the European Central Bank initiated QE and the VEU soared in January 2015 to May which marks a final high. VEU went up and tested the previous high on the May peak, creating a double top and rolled over. In August 2015, it broke below the red neckline. There was one more rally back above the red line, but it soon failed. Now this chart has resumed its downtrend.
When we look at the $SPX, we can see that it appears to be breaking down in the same fashion. It is the strongest stock index in the world so it is not a surprise that it is the last to roll over. The 200 DMA has been supportive all the way up and it has now become resistance.
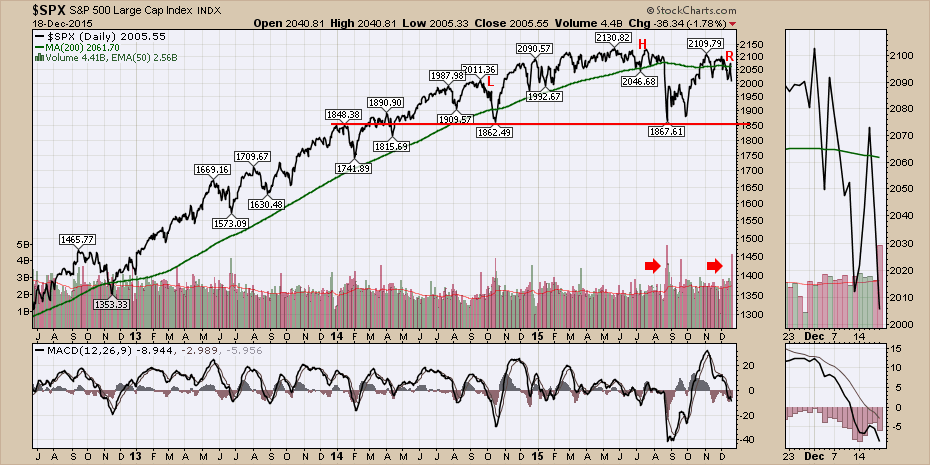
Currently, the volatility is increasing as laid out in the ChartWatchers article two weeks ago. You can click on this link to see the article titled When Markets Have Wider And Wider Swings. With the increasing volatility and the lack of support from the rest of the world markets, the next major test of support looks to be down around the 1860 level which means January will have renewed importance from a big picture support level.
I will be doing a Canadian Markets webinar on Tuesday for an in-depth review of Canada. Click on this link to get registered for the free webinar. The Canadian Technician 20151219. I cover some US market linkages that you may find valuable as well, so I hope you can join me. You can also follow me on twitter using @schnellinvestor.
Best wishes for the holiday season!
Good trading,
Greg Schnell, CMT
