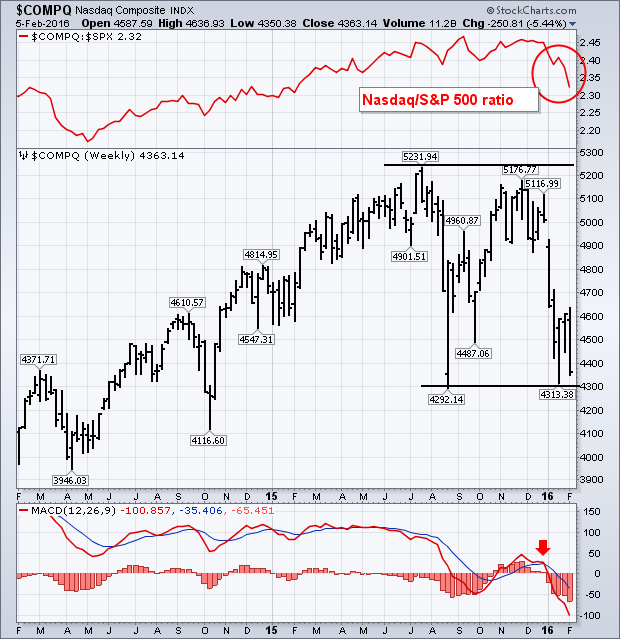
It's never a good sign to see the Nasdaq leading the rest of the market lower, which it did this week. A -3% plunge on Friday (and a -5% loss for the week) made it the weakest of the major market indexes. Heavy selling in software and internet stocks were especially troubling. So is its chart pattern. The weekly bars in the chart below show the Nasdaq Composite bearing down on its January and August lows. On a closing basis, the Nasdaq is already at the lowest level in more than a year. In addition, the Nasdaq/S&P 500 ratio (red line) on top of Chart 4 has fallen to the lowest level in a year. That's a bad omen for the rest of the market. Weekly MACD lines (below chart) have fallen to the lowest level since 2009. That greatly increases the odds that the Nasdaq will undercut its 2015 lows. That would complete a "double top" reversal pattern which would signal another downleg. If that happens, other other major stock indexes will most likely do that same. That would also confirm that the stock market has entered a bear market.