Hello Fellow ChartWatchers!
Wow, people are all over the place with their emotions right now. "Devastating Recession on the Way!" "Strong Tech Earnings Lead to Rally Mode!" "The Fed is Out to Kill the Economy!" and my personal favorite "Head and Shoulders Top Imminent!"
Let's calm down and back up a minute. The reality is that nothing has changed from a long-term technical perspective. Here's the actual technical situation:
 (Click on the chart for a live version)
Key Points:
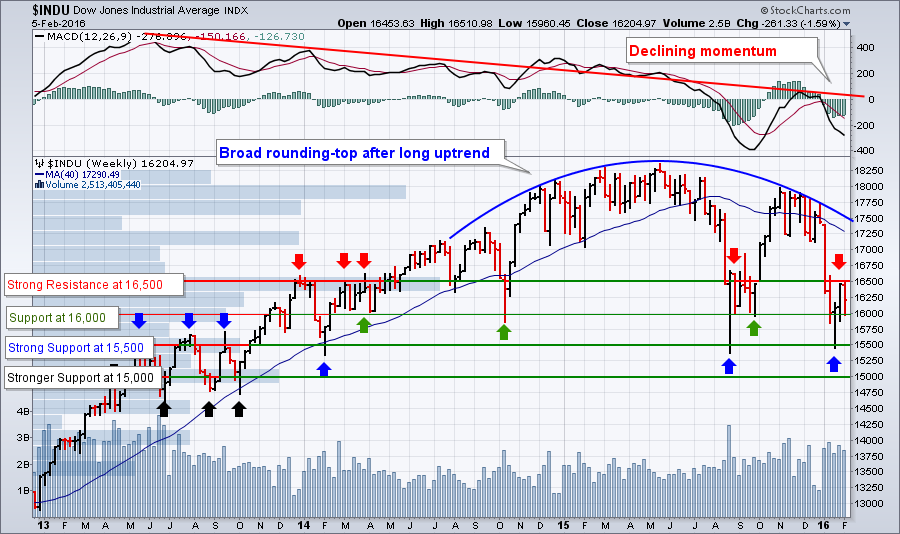
- The stock market is slowly rolling over after a long uptrend. This is a "Rounding Top" reversal formation with a couple of sharp down-spikes in August and January. Don't be fooled - there are no volume spikes to confirm any kind of Head & Shoulders top scenario.
- Weekly momentum (as viewed by the MACD at the top of the chart) continues to decline as it has since mid-2013. Until that reverses and the red trendline is broken significantly, the stock market will continue to be weak and volatile.
- In the near-term, there is stong overhead resistance at 16,500. The long blue Volume-by-Price bar sticking out horizontally from the left edge of the chart depicts that resistance clearly as does the 5 red arrows. Last week, the market tried and failed to breakout above that limit. 16,500 marks the upper-edge of the current bull/bear battlefield.
- Based on looking at where things have bounced in the past, there is important support at 16,000 however, the corresponding Volume-by-Price histogram bar is not very impressive.
- 15,500 is now HUGE. Any break below 15,500 will cause lots of people to take notice. Again, the Volume-by-Price bar doesn't stick out much, but the big double-bottom on the chart can be seen for miles.
- Finally, while the support for 15,000 developed back in 2013, it did result in a significant amount of volume and so this level may also have a roll to play.
- Support levels below 15,000 are very old - probably too old to have any immediate impact.
Bottom Line: On the Dow chart, the bulls and bears are battling it out between 16,500 and 16,000 right now. The overall tone of the market is bearish (rounding top and declining momentum) but the 16,000 has provided important support for the Dow at many critical times in the past going back to the start of 2014. When the bull and bears battled in this range last August, the result was a sharp upside breakout. Will that happen again? I'm not expecting it to, but I can't rule it out either.
With the market moving lower generally, prudent ChartWatchers know that now is the most important time of all to pay close attention to the technicals. While all the talking heads cast around for theories and answers to the pointless question "Why?", savvy technicians can quickly spot and profit from reaction rallies and counter-trend moves by focusing on finding stocks with increasing momentum and great relative strength.
- Chip
P.S. I will be speaking to my good friends at the Long Island Stock Traders Meetup Group on Tuesday, February 16th in Plainview, NY starting at 6:45pm. If you are somewhere close to that location, please come see me. I'd love to "meet up!"
