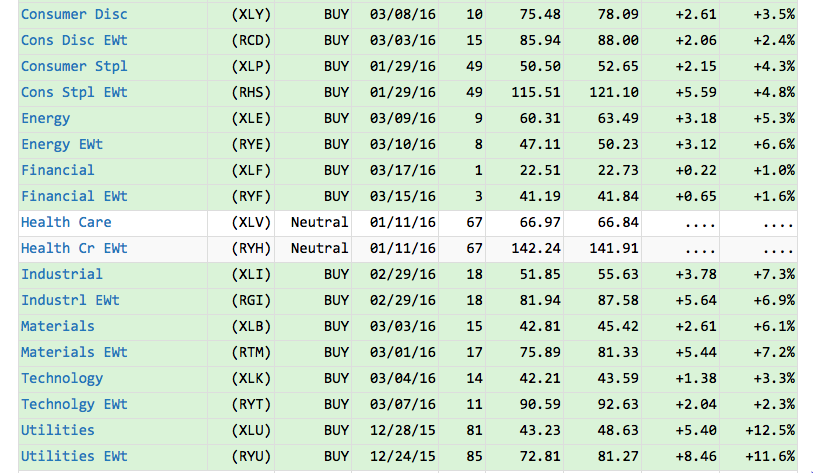
All of the sectors on the DecisionPoint Market Sector Summary are green with Intermediate-Term Trend Model BUY signals...except for Healthcare. As you can see from the excerpt of the report below, the current Neutral signal has been in effect for over two months. I decided it was time to investigate why and see if the Healthcare SPDR (XLV) was regaining its health as the other sectors have.
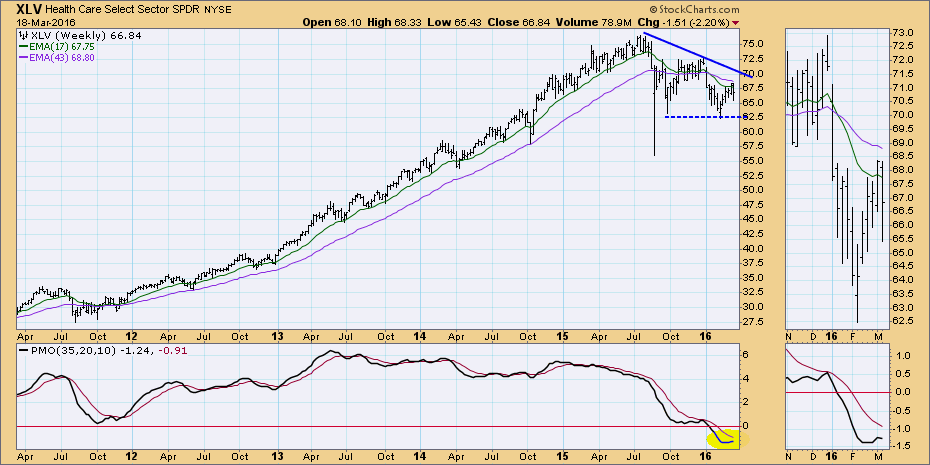
Looking at the longer-term picture on the weekly chart, the picture is not great. First, price was attempting to test resistance along the declining tops trendline and it failed to reach it. The pattern that is materializing is a bearish descending triangle. The expectation of this pattern is a break down below support. Looking from a distance, the Price Momentum Oscillator (PMO) looks bullish having bottomed in somewhat oversold territory. However, a closer look in the thumbnail reveals that the PMO has now turned down below the zero line and below its signal line which is very negative.
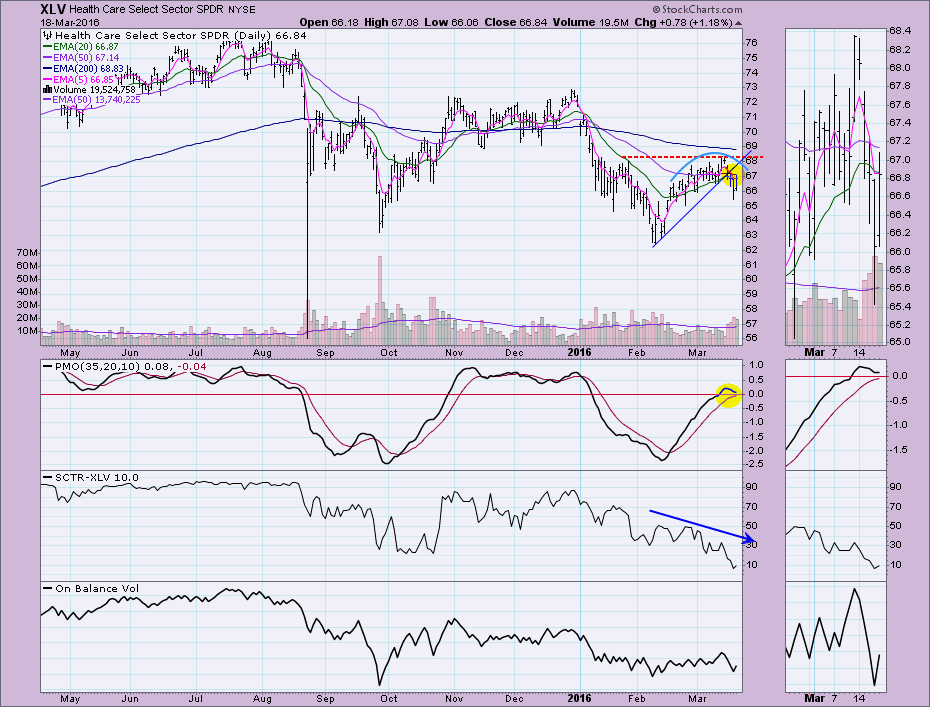
 A new Intermediate-Term BUY signal would turn XLV "green" on the DP Market/Sector Summary. An ITTM BUY signal is generated when the 20-EMA crosses above the 50-EMA. That will be very difficult given both EMAs are moving lower. Other problems with this chart are the bearish rounded top and the unsuccessful test of short-term overhead resistance; not to mention, the abysmal SCTR value. Internal weakness was already appearing as the SCTR trended lower during the last short-term rally. One positive is a PMO that is decelerating and could turn up before a negative crossover its signal line.
 The DecisionPoint On-Balance-Volume indicator suite shows negative divergences in all three time frames.
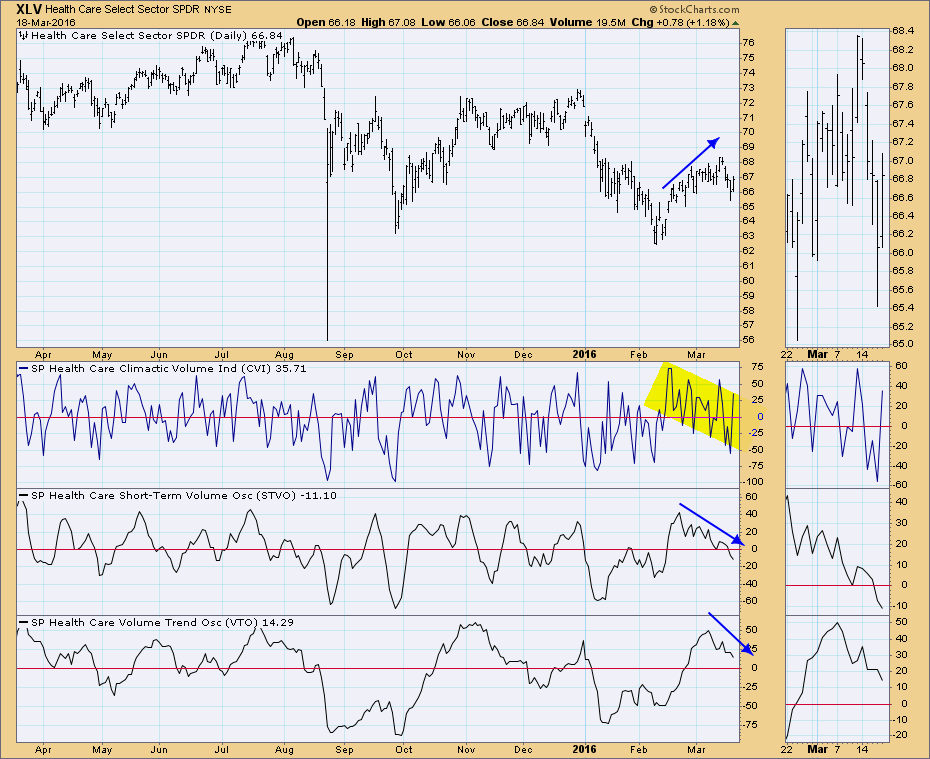 Conclusion: It doesn't appear that the healthcare sector is recovering. It appears weaker.
Come check out the DecisionPoint Report with Erin Heim on Wednesdays and Fridays at 7:00p EST, a fast-paced 30-minute review of the current markets mid-week and week-end. The archives and registration links are on the Homepage under “What’s New”.
Technical Analysis is a windsock, not a crystal ball.
Happy Charting!
- Erin


