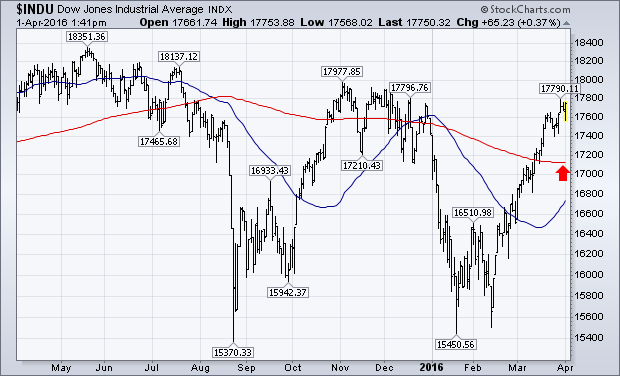
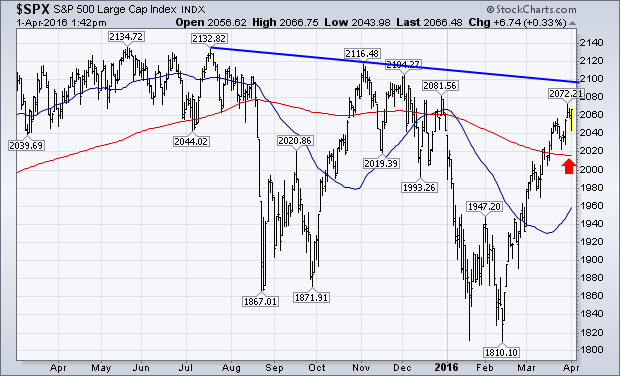
The chart below shows the Dow Industrials moving closer to a test of its fourth quarter highs near 18000. Given the steepness of the recent rally, it might run into some resistance there. But its trend is still higher. The second chart shows the S&P 500 moving closer to a resistance line drawn over its May/November highs. It may meet some resistance there as well. But it's trend is also higher. Earlier in the week, I showed the NYSE Advance-Decline line testing its 2015 high. I also suggested that a major drop in stock prices was highly unlikely with market breadth figures in such a strong position. That doesn't rule out a market pullback from overhead resistance. But any pullback should be viewed as part of a larger uptrend. Moving average support for the large cap indexes is likely near their 200-day averages.
- John


