If the Dow fell 900 points in two days, would that get our attention? This article will explain the linkage for North American investors and why I say it so succinctly.
The continued case for watching price action rather than Monetary Policy has resumed in Europe and Japan. Recently, one of the institutional money managers on television chimed in that Europe and Japan were the best places to invest because of the stimulative backdrop from their Central Banks. While those words of wisdom sound eloquent, let's look at the facts according to the market response to policy actions. Europe is making 4-week lows trapped under the 40 WMA but that is another story. I'll focus this on Japan for today. Please see my blogs (links provided below) and webinars for more regular updates on these global macro issues.
The Japanese Nikkei ($NIKK) stock market appears to be breaking down. From before and after the NIRP - Negative Interest Rate Policy - the Japanese investors are breaking their conviction that this works out.
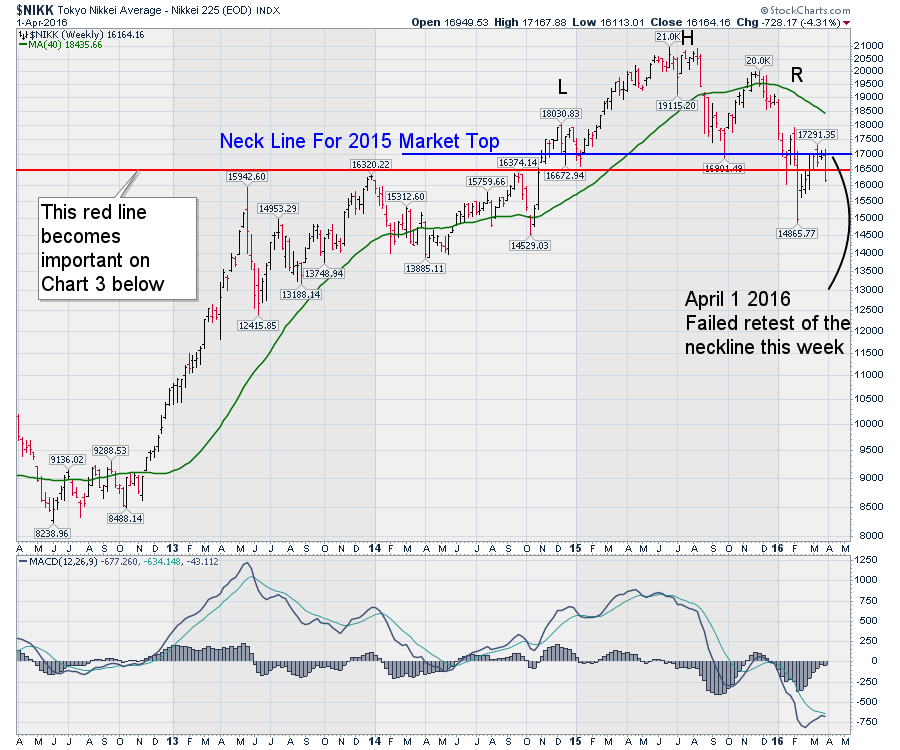
- The $NIKK made it's high in August 2015.
- Falling from 20914 to 17714, 15% in 2 weeks, it stopped near previous support at 17000 (16901).
- The Nikkei traded up to 20000, but the market stalled for three weeks there in November 2015.
- The Nikkei lost 15% again in 3 weeks from the end of December 2015 to the January 2016 low.
- The low around 16000 during the third week of January 2016 started a two-week bounce.
- After approaching 18000, the market plummeted to 14865 which is a 17% drop in just 2 weeks.
- In concert with the rest of the world bouncing off the February low, a rally moved up to 17291.
- We can see a stall in the price action for 5 weeks around 17000 at the neckline which is bad.
- The $NIKK stock index lost 900 points or more than 5% between Thursday and Friday.
- The real question is why should a North American investor be concerned?
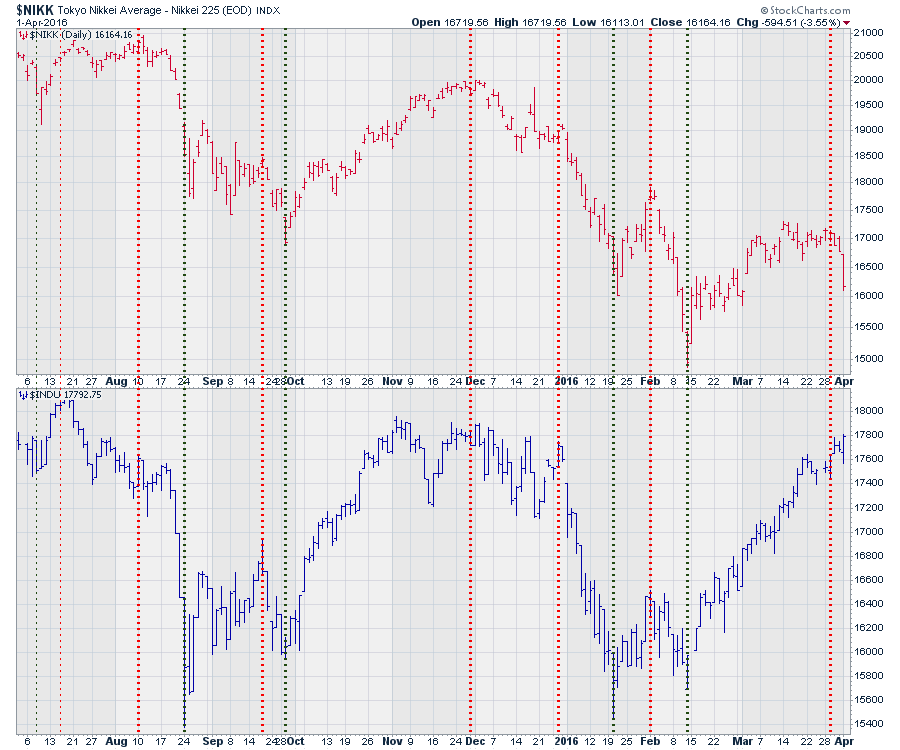
The Dow Jones Industrial Average ($INDU) trades around 17800 which is similar to the $NIKK at 17000 on Wednesday. If the $INDU loses 900 points in the next two days, would that make the news? Why do I say it like that? The two major drops in the last year in the USA (August 11,2015, December 30, 2015) coincide with major 15% drops in Japan. The big drop from February 1 in the USA of 7% coincides with the 17% drop in Japan. So if huge volatility shows up next week, will we be surprised or aware? Note the scale on the right. This $NIKK scale is moving by 500 points(!) per grid line. The scale is actually more than double the range (6000 points vs 3000 points) of the $INDU below which has a 200 point grid.
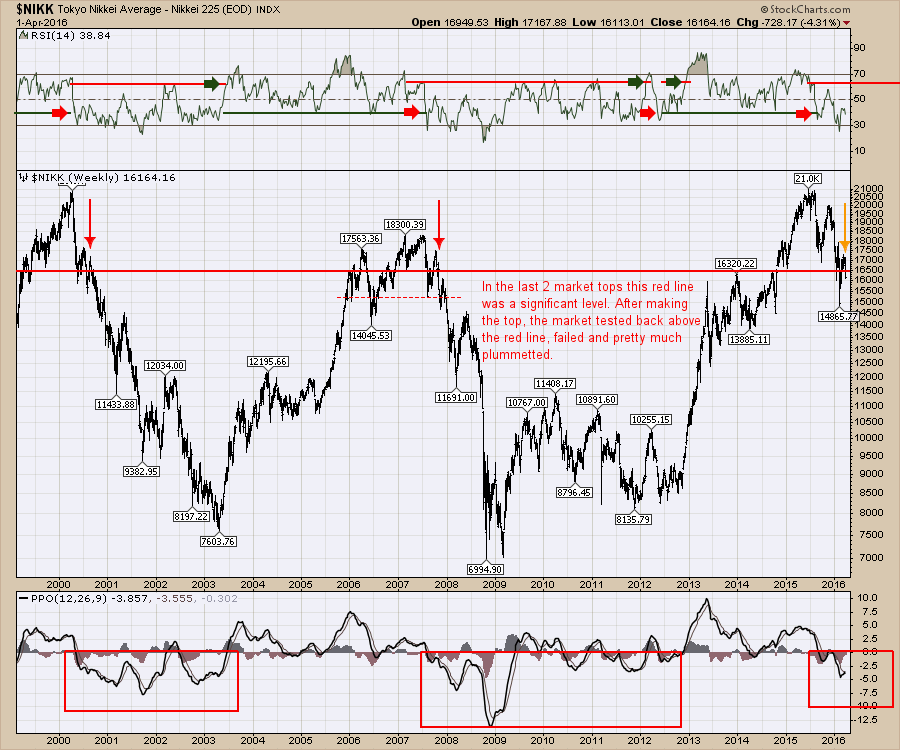
 Technically, where Japan is breaking down on the weekly charts and failing at the neckline is cause for serious concern. I have highlighted the RSI Bull and Bear markets. Currently, the RSI indicators point to a bear market. The MACD is in negative territory which is also confirming the bear market. But the red line in the chart can only be cause for concern. The Japanese economy has been deflating for 25 years and investors there sell quickly and ask questions later. Looking at this red horizontal line around 16500 we can see that the Japanese investors have aggressively sold stock after going below and above this level. If this support level fails to support their market, this definitely looks like the stage is set for an aggressive bear market. Moving through it with a 900 point plunge in two days suggests the selling is beginning in earnest. I think we can trade Japan on the short side against this level.
 There is no denying the US market is in better shape than other world markets. However, based on the similar dates shown in Chart 2 and similarities of global bear markets, this $NIKK breakdown looks ominous in the world's third-largest economy. Japan also ranks first for Debt-to-GDP which is not an honourable trait and could be one of the reasons this is starting to plummet. Back to the title of the article. Is the world pricing in the failure of Abenomics? It looks to me like the Japanese are.
Just when you thought things were about to stabilize, we get some very bearish price action internationally that could start another round of selling in America. You'll be reminded of 'Jim Cramer' saying how he hates to wake up early and check on the Asian markets to decide what is going to happen in America. The Dow does not have to fall as fast as Japan, but we should all be aware of the precarious nature of the global scene.
But the next question is: Will it send the rest of the world tumbling? I will do an around-the-world tour and spend some time on Tuesday, during my Canadian Technician Webinar. When the talking heads on television start to recommend global markets, you'll be up to speed on the price action and a global context. You can register (for free) by following this link. The Canadian Technician 20160405.
You can also track my blog articles by clicking yes on the subscription question on each one. Click here to see my latest Canadian Technician article and click here to see my latest Commodities Countdown article.
Good trading,
Greg Schnell, CMT


