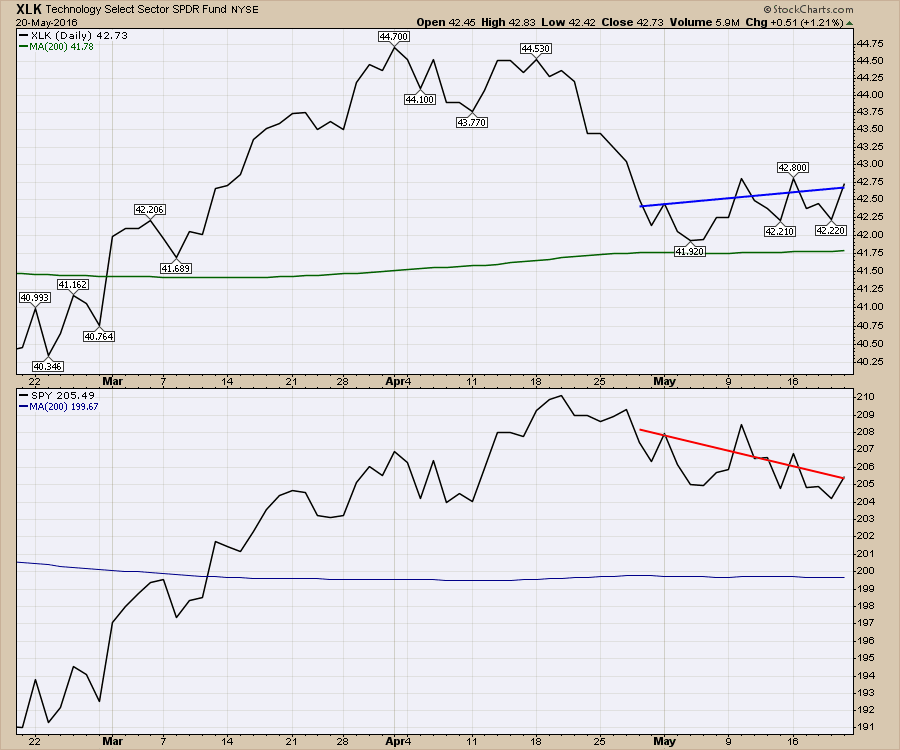
Technology has been one of the worst-performing sectors recently. However, over the last three weeks, the Tech sector represented by the SPDR ETF (XLK) has been performing slightly better than the SPX.
 Scanning through the carnage, I found lots of interesting charts. However, Broadcom (AVGO), Qualcomm (QCOM) and Cypress Semiconductor (CY) are charts that look investable here with close stops.
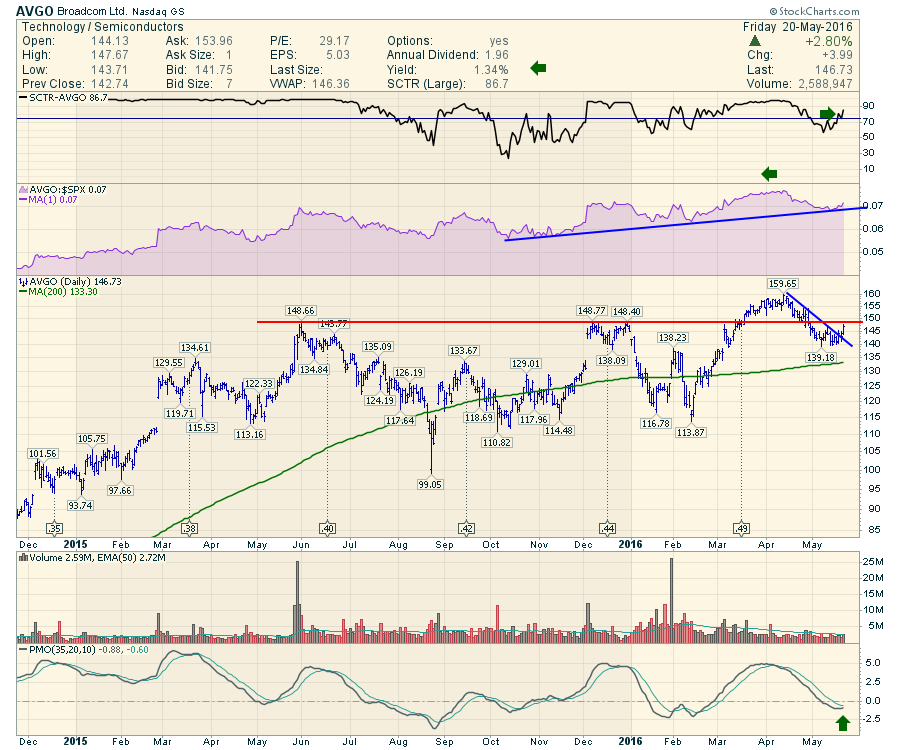
The Broadcom (AVGO) chart looks classic. After breaking out above year-long resistance, it pulled back just enough to make all the investors check their position with a stop loss. After consolidating for the first three weeks of May, AVGO broke the downtrend today. It also has an SCTR ranking above 75 which I like. The Relative strength in purple is rising again. The PMO is turning up and looks to have picked a nice entry. Lastly, the dividend is increasing every quarter(!) but is only 1.3% currently. All in all, a nice setup.
 Qualcomm (QCOM) has been in a downtrend for two years. This chart is set a little wider (2.5 years) to show the long downtrend. Notice the SCTR has not been above 75 for 2 years! Until this week! Digging into the rest of my indicators, the two-year downtrend in Relative Strength in purple is finally breaking out. The price is breaking four different technical factors.
1) The downtrend in red, 2) the horizontal dotted line in orange, 3) It is moving above the 200 DMA. 4) It is breaking out to new 6 month highs.
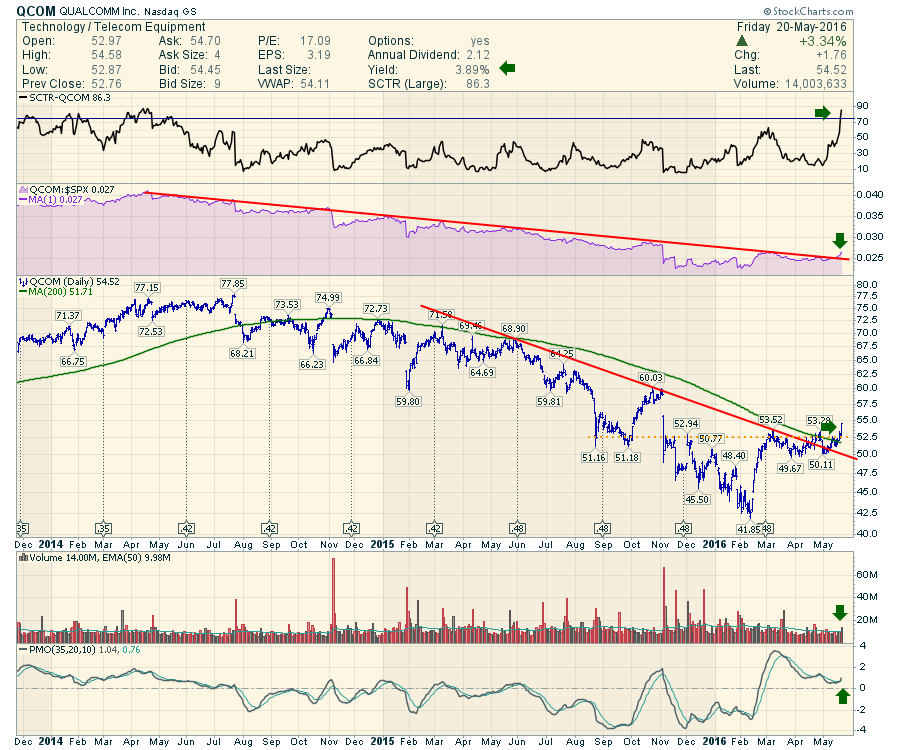 Just to finish the chart analysis above, the volume on today's surge was 40% above average. For momentum, the PMO is giving a positive cross while above zero today. Looking left on the PMO, we can see that has not been a popular signal on the chart. As a final boost of encouragement, the dividend has a history of rising and is 30% larger than two years ago. To wrap this up, the current dividend is just shy of 4% which is very appealing.
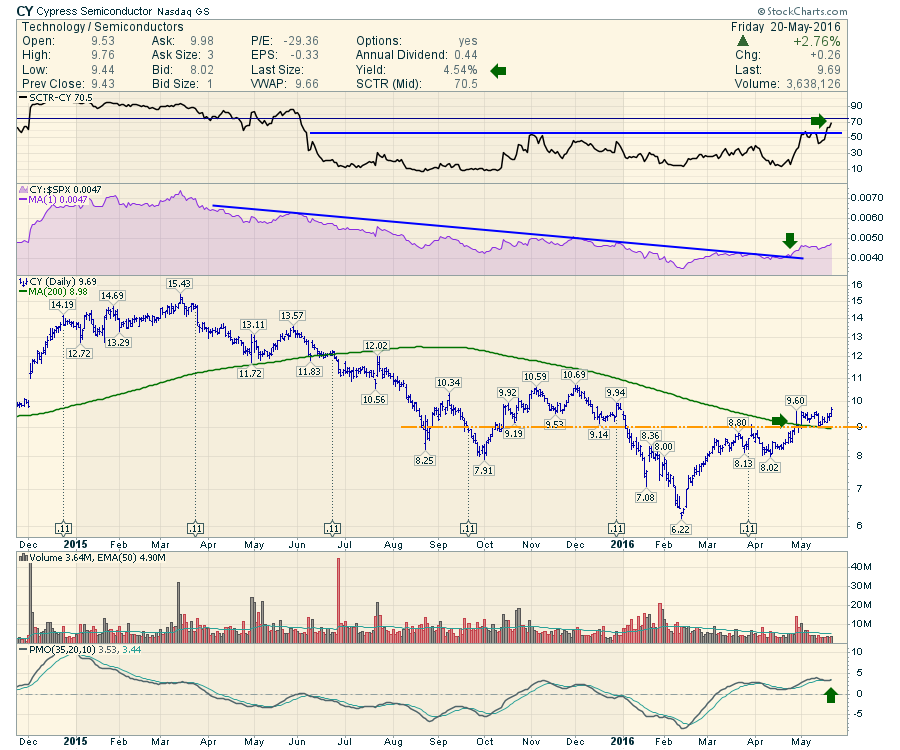
One more chart that is worthy of discussion is Cypress Semiconductors (CY). Cypress recently agreed to buy Broadcom's wireless Internet-of-Things (IoT) business. The chart also shows some nice changes in trend. First of all, the SCTR is making a new 11-month high, which is a big positive. The SCTR reading is currently 70% and I personally like it when they get above 75, but the rest of the chart has some compelling positives. The Relative Strength in purple is breaking out to new 4-month highs. It has also broken the 13-month downtrend. Price is holding above the orange support/resistance line and the 200 DMA. The volume has been stable but nothing exceptional. StockCharts.com proprietary momentum indicator, the PMO, gave a positive crossing signal above zero. That is really nice to see. As a bonus, this company is currently paying a 4.5% dividend that has been stable throughout the downtrend.
 If the technology sector keeps improving here, we should be able to take another run at the previous highs in indexes like the $SPX and $NDX. The last three weeks are starting to outperform, so maybe this is the turning point.
If you would like to follow my regular articles, You can find them on the blogs tab and use the drop-down menu on the right. The Commodities Countdown blog, The Canadian Technician blog and the Don't Ignore this Chart blog. Click on the Yes Button below each blog to get a copy delivered into your email.
Good trading,
Greg Schnell, CMT, MFTA.


