It has been a wild ride for the Technology SPDR (XLK) since August, but the ETF is showing signs of strength by holding the 200-day moving average in May. The red line shows the 200-day SMA dissecting the chart in the 41.5-42 area. Note that XLK broke above this key moving average in early March and is now testing this breakout here in May. I consider the cup half full (bullish) when XLK is above and half empty (bearish) when below.
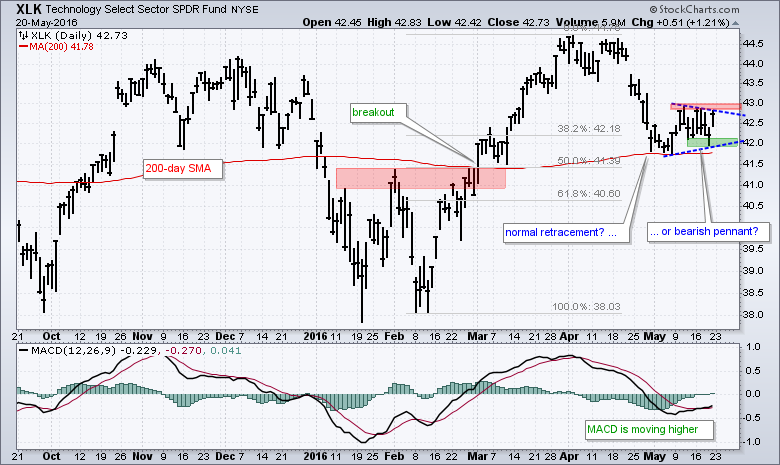
The May consolidation provides the first levels to watch for a directional signal. XLK fell rather sharply in late April, but this decline retraced around 50% of the prior advance and ultimately held the 200-day. The ETF firmed for three weeks and a breakout at 43 would suggest a successful test of the 200-day. We must also consider the alternative and this could be a bearish pennant. A break below Thursday's low would confirm this pattern and signal a continuation of the late April decline.
Note that XLK is a bit different than the Nasdaq 100 ETF (QQQ) because it does not have any biotech stocks and it does not have Amazon. The five biggest holdings are Apple (13%), Alphabet (10.39%), Microsoft (9.86%), Facebook (6.63%) and AT&T (5.82%). Together, these stocks account for around 45% of the ETF.
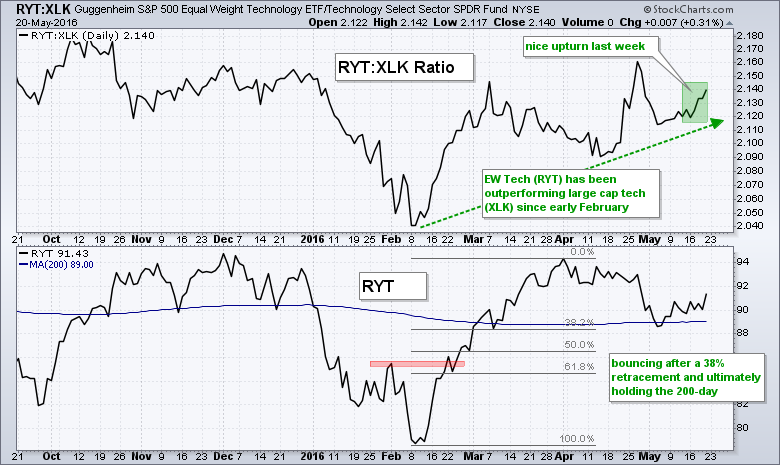
I also noticed that the Equal-weight Technology ETF (RYT) has been outperforming the Technology SPDR (XLK) since early February. This means the average tech stock is doing better than large-cap tech stocks. The main window on the chart below shows the price relative (RYT:XLK ratio) zigzagging higher the last few months and turning again last week. The bottom window shows RYT bouncing around the 200-day moving average in early May and surging 1.5% on Friday to turn positive for the month.
 ****************************************
Thanks for tuning in and have a good weekend!
--Arthur Hill CMT
Plan your Trade and Trade your Plan
*****************************************


